
Every manufacturing defect has a price. Most Indian manufacturers can tell you their scrap rate. Very few can tell you their total Cost of Poor Quality — and that gap is where profits silently disappear.
This guide explains what COPQ is, how to calculate it (with a worked example in Indian Rupees), what benchmarks to aim for, and how to systematically reduce it. Whether you run a small Gujarat-based SME or a mid-size auto components facility in Pune, this framework applies directly to your operation.
What Is the Cost of Poor Quality (COPQ)?
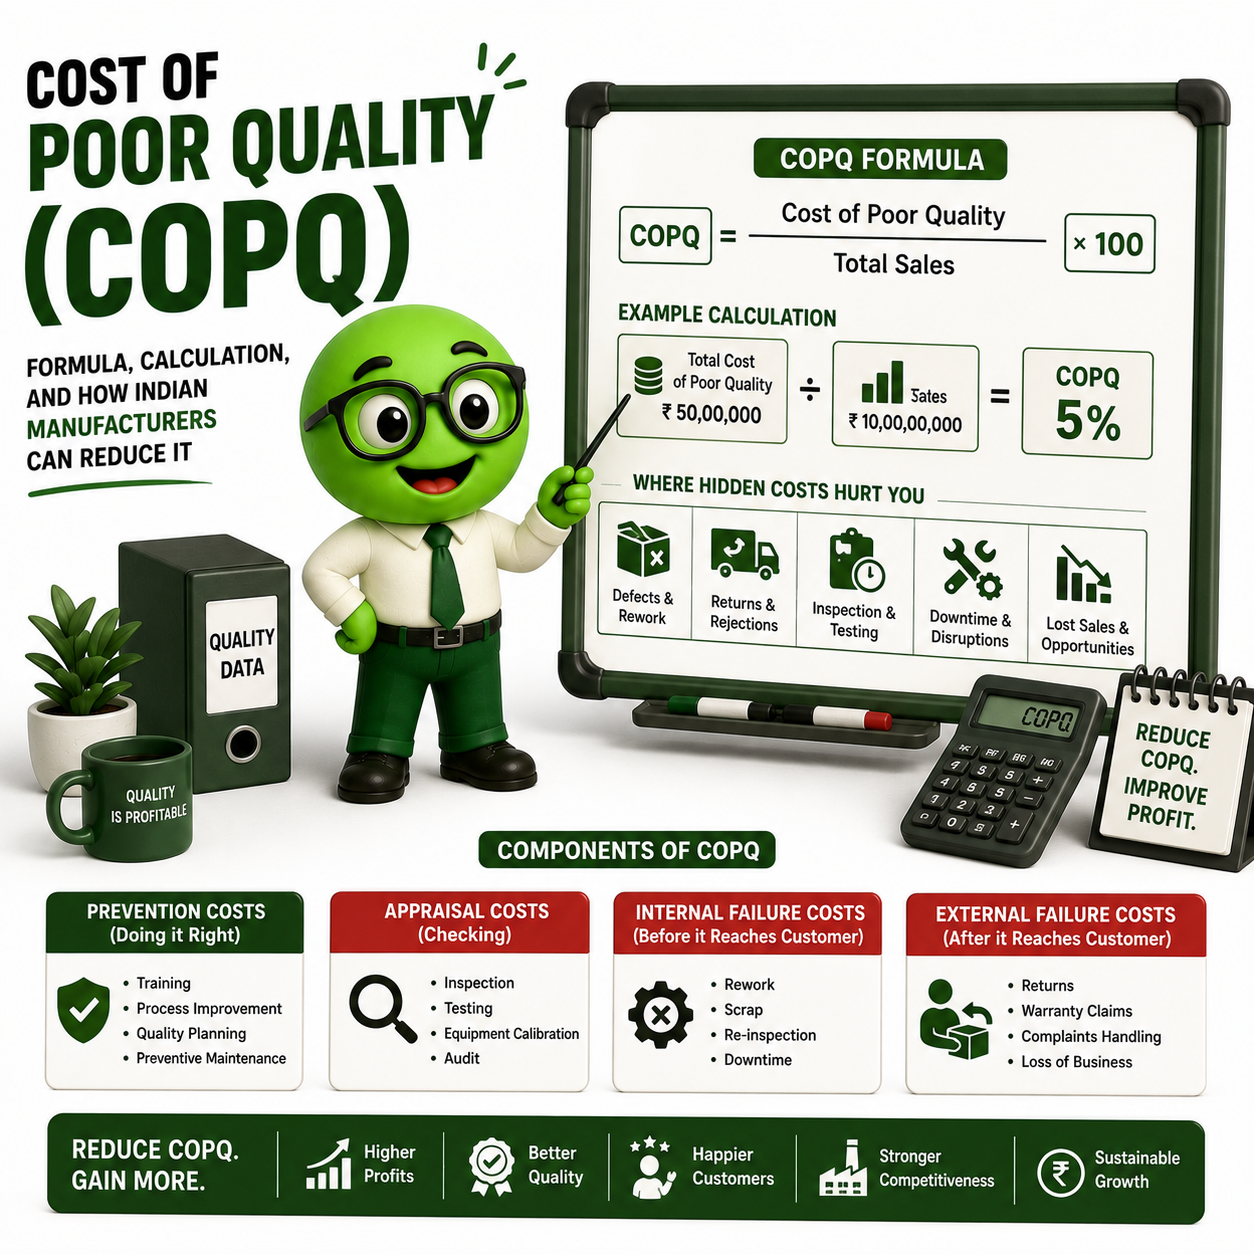
The Cost of Poor Quality (COPQ) is the total financial cost your business bears because things were not done right the first time. It includes every rupee spent detecting, fixing, or suffering the consequences of defects — whether those defects are caught inside your factory or by your customer.
COPQ is not just your scrap bin. It includes rework labour, warranty claims, customer complaints, inspection time, and the orders you never received because a buyer lost confidence in your quality.
According to the American Society for Quality (ASQ), COPQ typically represents 5% to 30% of a company’s total revenue — and for most Indian SME manufacturers, it sits closer to the higher end of that range, largely because the hidden components go unmeasured.
Key distinction: COPQ is a subset of the broader Cost of Quality (COQ). Understanding the difference matters for where you focus your improvement effort.
COPQ vs COQ: What Is the Difference?
This is one of the most common points of confusion in quality management. Here is a clear comparison:
| Aspect | Cost of Quality (COQ) | Cost of Poor Quality (COPQ) |
|---|---|---|
| Definition | Total cost of all quality-related activities | Cost specifically caused by failures and defects |
| Includes | Prevention + Appraisal + Failure costs | Internal Failure + External Failure costs only |
| Goal | Balance investment in quality vs. failure costs | Eliminate or minimise failure costs entirely |
| Useful for | Strategic quality investment decisions | Identifying waste and failure-driven losses |
| Who tracks it | Quality managers, finance teams | Operations, quality, and plant heads |
| Target | Optimise the ratio | Drive toward zero |
Simple way to remember it: COQ is everything you spend because of quality (including prevention). COPQ is everything you lose because of a lack of quality. You want COQ to be strategically invested. You want COPQ to go as close to zero as possible.
The Four Components of COPQ
The standard COPQ formula has four categories. Two are “failure” categories (which make up COPQ proper). Two are “good investment” categories:
COPQ Formula
COPQ = Internal Failure Costs + External Failure CostsFull Cost of Quality Formula
COQ = Prevention Costs + Appraisal Costs + Internal Failure Costs + External Failure CostsLet’s understand each category with Indian manufacturing examples:
1. Internal Failure Costs
Defects caught before the product reaches the customer
| Cost Type | Description | Indian Manufacturing Example |
|---|---|---|
| Scrap | Material that cannot be reworked and must be discarded | Rejected castings at a Rajkot engineering unit |
| Rework | Labour and material to correct a defective product | Re-welding a subframe at an auto ancillary in Pune |
| Re-inspection | Cost of inspecting reworked product again | QC time on re-tested pharmaceutical batches |
| Downtime due to defects | Machine or line stoppage caused by quality issues | Line stoppage at a Surat textile mill due to yarn defect |
| Excess inventory due to yield loss | Overproduction to compensate for expected rejection | Extra raw material purchased to offset process rejection |
| Failure analysis time | Engineering time to investigate root cause | Quality engineer hours spent on Ishikawa analysis |
2. External Failure Costs
Defects discovered after the product reaches the customer — always the most expensive category
| Cost Type | Description | Indian Manufacturing Example |
|---|---|---|
| Warranty claims | Cost of repair or replacement under warranty | Auto component returns from OEM customers |
| Customer returns | Logistics + processing cost of returned goods | Returned FMCG product batches from a modern trade buyer |
| Customer complaint resolution | Time and cost of managing complaints | After-sales service cost for an industrial equipment maker |
| Product recall | Full recall logistics and communication cost | Pharma recall due to contamination (Schedule M non-compliance) |
| Lost future revenue | Orders lost due to reputational damage | Export customer switching vendor after quality incident |
| Penalty and legal costs | Contractual penalties, litigation | IATF 16949 customer chargebacks to a Tier-1 auto supplier |
3. Appraisal Costs
Costs of detecting defects — a necessary investment
- Incoming raw material inspection
- In-process quality checks and SPC monitoring
- Final product testing and certification
- Lab testing and third-party audits
- Calibration of measuring instruments
4. Prevention Costs
Costs of preventing defects — the highest-ROI investment in quality
- Employee quality training (e.g., GreenDot’s in-plant lean and quality programs)
- ISO 9001 QMS implementation and maintenance
- Process improvement projects (Six Sigma, Kaizen)
- Supplier development and qualification
- Quality engineering and design reviews
The COPQ Iceberg: What Most Manufacturers Don’t Measure
Most manufacturers measure only the visible portion of COPQ — scrap, rework, and warranty. These are the tip of the iceberg.
Visible COPQ (typically measured):
- Scrap costs
- Rework costs
- Warranty returns
Hidden COPQ (rarely measured, often larger):
- Excess capacity built to compensate for rejections
- Customer dissatisfaction and lost repeat orders
- Expediting costs caused by quality-related delays
- Management time spent on firefighting defects
- Morale and productivity loss in teams that rework repeatedly
- The “hidden factory” — the parallel, informal production system your team runs just to fix things
The Hidden Factory is a term used in quality management to describe the unplanned, undocumented rework, reinspection, and correction activity that happens in parallel with your main production process. In many Indian SME factories, the hidden factory consumes 15–25% of total production capacity without ever appearing in official reports.
COPQ Benchmarks: What Is a Good COPQ Percentage?
World-class manufacturers track COPQ against revenue. Here are the standard benchmarks from ASQ and Six Sigma literature:
| Performance Level | COPQ as % of Revenue | Sigma Level | Description |
|---|---|---|---|
| World Class | < 1% | 6 Sigma | Defect rate of 3.4 per million opportunities |
| Excellent | 1–5% | 5 Sigma | Top quartile manufacturers globally |
| Good | 5–10% | 4 Sigma | Solid quality systems in place |
| Average | 10–15% | 3–4 Sigma | Typical for mid-size Indian manufacturers |
| Poor | 15–25% | 3 Sigma | Significant waste, reactive quality management |
| Critical | > 25% | < 3 Sigma | Business risk; urgent intervention needed |
Indian SME context: Based on GreenDot’s consulting experience across Gujarat and Maharashtra, most SME manufacturers we engage with have an actual COPQ between 12–22% of revenue — though their perceived COPQ (what they formally track) is often as low as 3–5%. The gap is the hidden factory.
How to Calculate COPQ: A Worked Example (₹)
Here is a realistic illustrative example of a COPQ calculation for a small auto-components manufacturer.
Company profile (illustrative): A 120-employee auto components manufacturer based in Rajkot, Gujarat. Monthly revenue: ₹1.2 crore. Products: Precision machined parts supplied to Tier-1 OEMs.
Step 1: Gather Monthly Cost Data
| Category | Cost Item | Monthly Amount |
|---|---|---|
| Internal Failure | Scrap material | ₹1,85,000 |
| Rework labour | ₹1,10,000 | |
| Re-inspection time | ₹28,000 | |
| Line downtime due to quality | ₹55,000 | |
| Internal Failure Subtotal | ₹3,78,000 | |
| External Failure | Warranty claims / OEM chargebacks | ₹1,20,000 |
| Customer returns (logistics + processing) | ₹45,000 | |
| Customer complaint management time | ₹22,000 | |
| External Failure Subtotal | ₹1,87,000 | |
| Total COPQ | ₹5,65,000/month | |
| Annual COPQ | ₹67,80,000/year |
Step 2: Calculate COPQ as % of Revenue
COPQ % = (Total COPQ ÷ Monthly Revenue) × 100
        = (₹5,65,000 ÷ ₹1,20,00,000) × 100
        = 4.7% of monthly revenue
At 4.7%, this manufacturer is performing above average — but still leaving ₹67.8 lakhs on the table every year.
Step 3: Set a Target
If this manufacturer reduces COPQ to 2% of revenue (a realistic 12-month target with lean quality tools):
Target COPQ = 2% × ₹1,20,00,000 = ₹2,40,000/month
Annual saving = (₹5,65,000 − ₹2,40,000) × 12 = ₹39,00,000/year
A focused COPQ reduction program could recover ₹39 lakhs per year — without adding a single new customer.
How to Calculate COPQ in Excel
Use this simple Excel template structure:
| Column A | Column B | Column C |
|---|---|---|
| Cost Category | Cost Item | Monthly Amount (₹) |
| Internal Failure | Scrap | [Enter value] |
| Internal Failure | Rework | [Enter value] |
| Internal Failure | Re-inspection | [Enter value] |
| Internal Failure | Downtime | [Enter value] |
| External Failure | Warranty/Returns | [Enter value] |
| External Failure | Complaint handling | [Enter value] |
| Total COPQ | =SUMIF(A:A,”Internal Failure”,C:C)+SUMIF(A:A,”External Failure”,C:C) | |
| Monthly Revenue | [Enter value] | |
| COPQ % | =(Total COPQ Cell / Revenue Cell) × 100 |
Download: GreenDot’s free COPQ Calculator Template in Excel is available through our website. It includes automatic % calculations, trend tracking across 12 months, and a simple dashboard.
[Contact GreenDot to request the free template →]
How to Reduce COPQ: GreenDot’s 6-Step Framework
Measuring COPQ is the first step. Reducing it requires a structured approach. Here is the framework GreenDot uses with Indian manufacturing clients:
Step 1: Measure the Full COPQ (Including Hidden Costs)
Most manufacturers underestimate COPQ by 3–5x because they only track scrap. Start by mapping all four categories and capturing costs that don’t appear in standard MIS reports — rework labour, complaint management time, expediting costs.
Step 2: Stratify by Category and Process
Not all defects cost equally. Use a Pareto analysis to identify which product lines, processes, or machines are generating the most COPQ. Focus your first improvement efforts where the cost is highest.
Step 3: Identify Root Causes
For each major COPQ driver, conduct a structured root cause analysis — 5-Why, Fishbone (Ishikawa), or FMEA. Do not implement solutions before root causes are confirmed.
Step 4: Apply the Right Quality Tool to Each Root Cause
| Root Cause Type | Recommended Tool |
|---|---|
| Process variation | SPC (Statistical Process Control) |
| Operator error | Poka-Yoke (error proofing), SOPs, visual controls |
| Machine inconsistency | TPM (Total Productive Maintenance) |
| Design weakness | DFMEA, Design for Manufacturability |
| Incoming material | Supplier development, incoming inspection |
| Poor process definition | 5S, standardised work, process mapping |
Step 5: Implement and Track with a Control Plan
Each solution needs a control plan — who is responsible, what is measured, how often, and what action is triggered if the metric goes out of range. Without a control plan, most quality improvements reverse within 90 days.
Step 6: Recalculate COPQ Monthly and Report to Management
Make COPQ a regular KPI reviewed in monthly management meetings alongside revenue and OEE. When quality cost becomes visible at the P&L level, it gets the attention it deserves.
COPQ and Lean Manufacturing: Which Lean Tools Reduce Which Costs?
Lean manufacturing is one of the most effective frameworks for reducing COPQ — but only when the right tools are applied to the right problems.
| COPQ Category | High-Impact Lean/Quality Tools |
|---|---|
| Internal Failure — Scrap | 5S, SPC, Poka-Yoke, Standard Work |
| Internal Failure — Rework | FMEA, Root Cause Analysis, Visual Controls |
| Internal Failure — Downtime | TPM, SMED, Preventive Maintenance |
| External Failure — Warranty | Control Plans, PFMEA, Customer Feedback loops |
| External Failure — Returns | Outgoing inspection, packaging standards, logistics quality |
| Appraisal — Inspection | Automated inspection, SPC (reduces 100% inspection need) |
| Prevention | Kaizen, ISO 9001 QMS, employee training |
COPQ Across Indian Industries: Typical Ranges
| Industry Sector | Typical COPQ Range | Key COPQ Drivers | Common Lean Solutions |
|---|---|---|---|
| Auto Components | 4–18% of revenue | OEM chargebacks, rework, IATF audits | PFMEA, Control Plans, SPC |
| Pharmaceuticals | 3–12% | Batch rejection, Schedule M compliance | GMP systems, deviation management |
| Textiles (Gujarat) | 8–20% | Fabric defects, shade variation, rework | SPC on dyeing, visual inspection systems |
| FMCG / Packaging | 5–15% | Labelling errors, fill weight variation | Poka-Yoke, automated check-weighers |
| Chemical / Process | 6–18% | Yield loss, re-blending, safety incidents | SPC, process capability improvement |
| Engineering / Fabrication | 10–22% | Dimensional rejection, weld defects | SWI, first-article inspection, training |
Ranges are indicative based on industry literature and GreenDot consulting experience. Actual COPQ varies by company size, quality maturity, and customer requirements.
COPQ and ISO 9001: The Connection
ISO 9001:2015 Clause 10 (Improvement) specifically requires organisations to:
- Determine and select opportunities for improvement
- Take action to control and correct nonconformities
- Evaluate the effectiveness of corrective actions
Tracking COPQ is one of the most direct ways to comply with and benefit from ISO 9001. Companies with a certified QMS typically have COPQ that is 30–50% lower than non-certified peers — not because certification itself reduces defects, but because the discipline of measurement and corrective action that comes with it does.
GreenDot’s ISO 9001 Training Program prepares Indian manufacturers to implement QMS systems that drive measurable COPQ reduction — not just certification for its own sake.
Learn about our ISO 9001 program →
COPQ for Indian SMEs: Three Specific Challenges
Indian SME manufacturers face COPQ challenges that are different from those described in global textbooks:
1. Informal rework is not tracked In many Indian factories, rework happens on the shop floor without being recorded — operators fix things quietly to avoid management attention. This makes COPQ invisible and unmeasurable. The solution is a blame-free rework recording system where data is used for improvement, not blame.
2. Customer pressure suppresses complaint data When a customer complains, many Indian suppliers absorb the cost silently to protect the relationship — without formally logging it as a COPQ event. Over time, this hides the true cost of poor quality and prevents root cause action.
3. Prevention investment is seen as a cost, not a return Training, FMEA, and quality engineering are often the first budgets cut in Indian SMEs under margin pressure. This creates a cycle: cutting prevention leads to more failures, more failures increase costs, costs force more cuts. The COPQ calculation above — showing ₹39 lakhs/year in recoverable value — is the business case for why prevention investment pays back rapidly.
Frequently Asked Questions About COPQ
What is the cost of poor quality in simple terms?
COPQ is the total amount your business loses because products or services were not made correctly the first time. It includes the cost of fixing defects inside your factory (scrap, rework) and the cost of defects that reach your customer (warranty claims, returns, lost orders). For most manufacturers, COPQ is significantly larger than they realise because many of its components are never formally tracked.
What is the difference between COPQ and COQ?
COQ (Cost of Quality) is the total cost of all quality-related activity — including prevention (training, quality systems) and appraisal (inspection, testing) as well as failure costs. COPQ is only the failure portion — internal failures plus external failures. You want to invest in COQ prevention and appraisal in order to reduce COPQ.
What percentage of revenue is a typical COPQ?
According to ASQ, COPQ typically ranges from 5–30% of sales revenue. World-class manufacturers operate below 1–5%. Many Indian SME manufacturers, when they measure COPQ fully for the first time, find it is between 10–20% of revenue — much higher than they expected.
What is an example of internal failure cost?
A machining unit that produces 50 defective components per 1,000 and scraps them has an internal failure cost. If each component costs ₹200 in material and ₹80 in labour, and 50 are scrapped daily, the internal failure cost from scrap alone is ₹14,000 per day — ₹42 lakhs per year on one machine.
What is an example of external failure cost?
An auto component supplier that receives an OEM chargeback of ₹1.5 lakhs for a quality escape, plus ₹40,000 in logistics for part retrieval and replacement, plus 8 hours of engineer time for investigation and corrective action — all of that is external failure cost. Multiply this by even a few incidents per year and the impact is significant.
What is the “hidden factory” in quality?
The hidden factory refers to all the unplanned rework, reinspection, and correction activity that runs in parallel with your main production process — but is never formally recorded. In many Indian SME factories, the hidden factory consumes 15–25% of total capacity. Identifying and eliminating the hidden factory is often the biggest single opportunity in COPQ reduction.
How do I reduce COPQ quickly?
The fastest COPQ wins typically come from: (1) accurately measuring COPQ for the first time — awareness alone drives behaviour change; (2) eliminating your top 3 defect causes using root cause analysis; (3) implementing basic visual controls and Poka-Yoke devices on your highest-rejection process. Most manufacturers can reduce COPQ by 30–40% within 6 months with focused effort.
How is COPQ calculated in Excel?
Create a table with five columns: Category, Cost Item, Monthly Amount, Annual Amount (Monthly × 12), and % of Revenue. List every internal failure and external failure cost item. Sum internal and external failures separately, then add them for total COPQ. Divide by monthly revenue and multiply by 100 to get COPQ%. GreenDot provides a free Excel template for this — contact us to request it.
Is COPQ relevant for service businesses in India?
Yes. COPQ applies to any business where rework, error correction, or customer complaints exist. In banking, COPQ manifests as transaction error correction, complaint resolution, and regulatory penalties. In logistics, it appears as mis-delivered shipments, damage claims, and rescheduled deliveries. In education and training businesses, it shows up as repeat sessions, course corrections, and low learner satisfaction scores.
How does COPQ relate to lean manufacturing?
Lean manufacturing identifies and eliminates the eight wastes (defects, overproduction, waiting, non-utilised talent, transportation, inventory, motion, extra processing). Defects — the first waste — are the direct driver of COPQ. Lean tools like Poka-Yoke, 5S, SPC, TPM, and standard work directly reduce COPQ by preventing defects at their source rather than detecting them later.
How GreenDot Helps Indian Manufacturers Reduce COPQ
GreenDot Management Solutions works with Indian manufacturers across Gujarat, Maharashtra, and Rajasthan to implement structured COPQ reduction programs. Our approach combines:
- COPQ Measurement Workshop — a 1-day session to identify and quantify your full COPQ for the first time, including hidden costs
- Root Cause Analysis Training — equipping your quality and production teams with 5-Why, Ishikawa, and FMEA skills
- Lean Quality Implementation — applying the right tools (SPC, Poka-Yoke, TPM, 5S) to your specific defect drivers
- ISO 9001 QMS Setup — building quality management systems that make COPQ reduction sustainable
- COPQ Tracking Dashboard — a simple management reporting system that keeps COPQ visible at the leadership level
We work in Hindi and Gujarati alongside English, making implementation practical for shop-floor teams.