
What Is TPM and Why Does the 16 Losses Framework Exist?
Total Productive Maintenance (TPM) is a company-wide approach to equipment management that aims to achieve zero breakdowns, zero defects, and zero accidents. Developed by the Japan Institute of Plant Maintenance in the early 1970s, TPM is built on 8 pillars — from Autonomous Maintenance to Planned Maintenance to Focused Improvement.
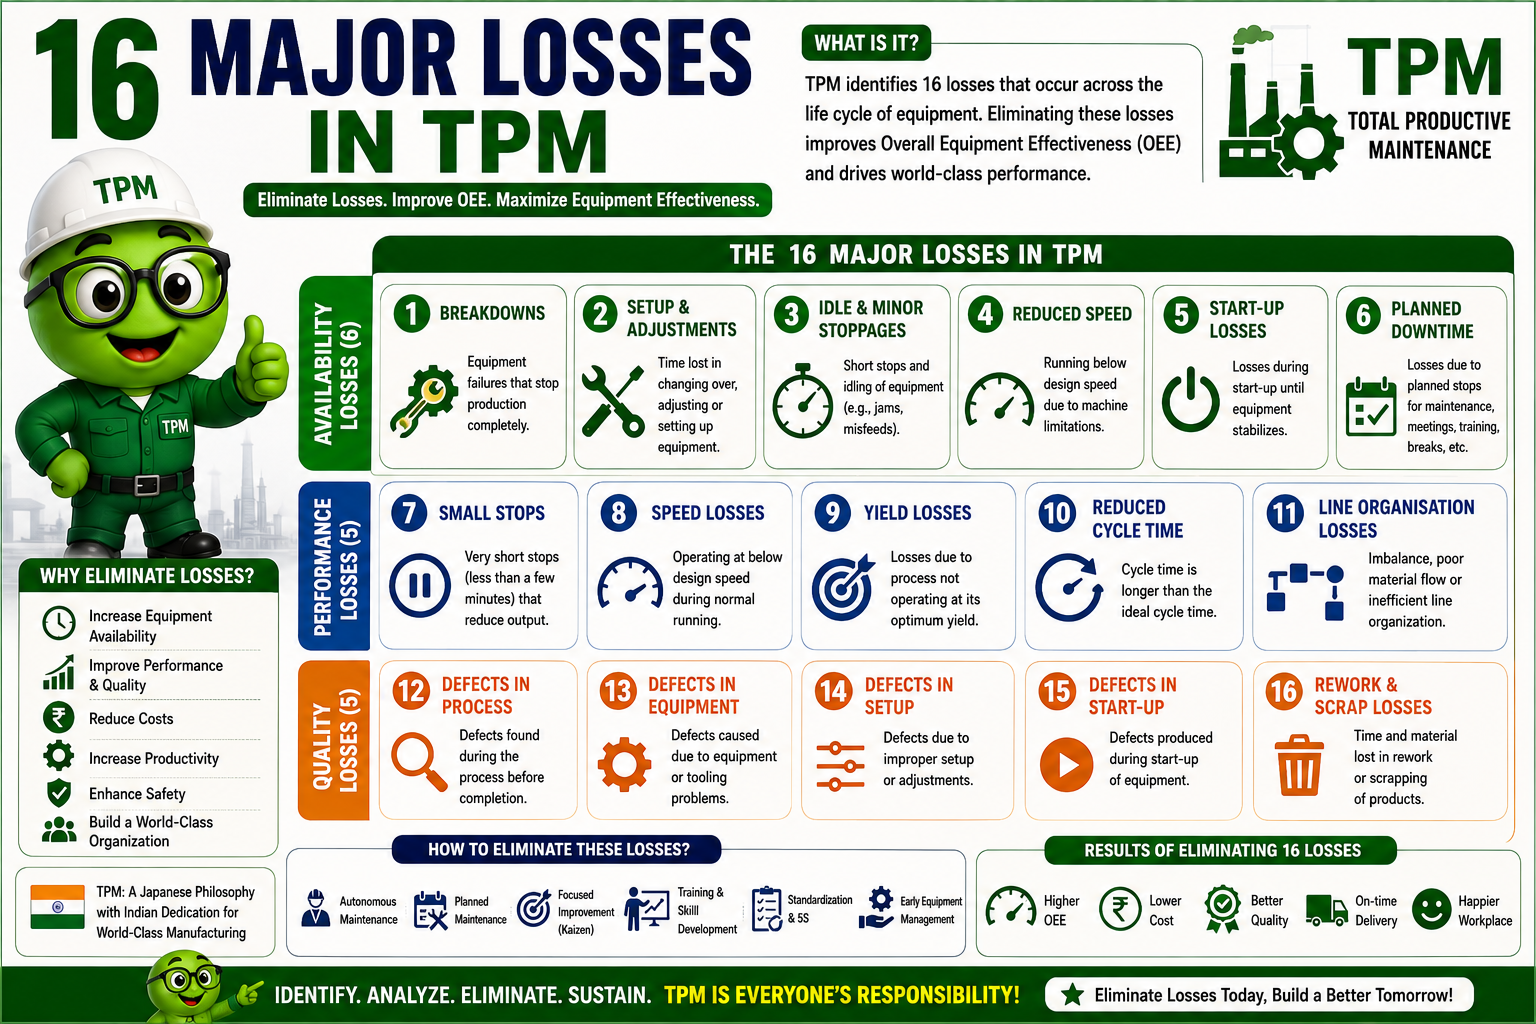
The 16 Major Losses framework is the measurement engine inside TPM. It answers one precise question: Where exactly is your plant losing productivity?
Before GreenDot begins any TPM implementation — whether in a chemical plant in Vapi, a precision engineering shop in Rajkot, or a pharmaceutical unit in Ahmedabad — we start by mapping the plant against these 16 losses. The losses tell us not just how much efficiency is being lost, but why and where to intervene first.
In 25+ years of working with Indian manufacturers, I have found that most plants suffer from 4 to 6 losses simultaneously — but focus their energy on only the most visible one, usually breakdowns. The hidden losses — management loss, line organisation loss, startup loss — are often costing more and are far easier to fix. — Nirav Trivedi, GreenDot Management Solutions
The 3 Categories: How the 16 Losses Are Organised
The JIPM groups the 16 losses into three parent categories. Understanding this structure is essential — each category requires a different intervention approach.
Category 1: Equipment Losses (Losses 1–8)
These losses reduce the OEE (Overall Equipment Effectiveness) of your machines. They pull down one of three OEE pillars: Availability, Performance, or Quality.
OEE Formula:
OEE = Availability × Performance Rate × Quality RateWorld-class OEE benchmark: 85%+ Average Indian manufacturing plant OEE: 45–60% GreenDot client average OEE after TPM implementation: 65–78% (within 12–18 months)
Category 2: Human / Labour Losses (Losses 9–13)
These losses reduce OPE (Overall Plant Effectiveness) — the efficiency of your people, not just your machines. They are measured separately from OEE and are frequently overlooked in Indian SMEs.
OPE Formula:
OPE = OEE × Labour Utilisation RateCategory 3: Resource Consumption Losses (Losses 14–16)
These losses affect your cost structure directly — material yield, energy consumption, and tooling. In Indian manufacturing, where energy costs represent 8–15% of production cost, these losses are often worth more money than equipment losses.
The 16 Major Losses: Detailed Explanation with Indian Manufacturing Examples
EQUIPMENT LOSSES (Losses 1–8)
These losses are measured through OEE and tracked at the machine or line level.
Loss 1: Breakdown Loss
What it is: Unplanned stoppage of equipment due to failure — the machine stops working and production halts until it is repaired.
How it shows up: A hydraulic press fails mid-shift. A motor burns out. A CNC spindle seizes. The line stops. Maintenance is called. Time is lost.
OEE impact: Reduces Availability.
Most common in Indian plants: Engineering, auto components, foundries, textile mills — anywhere equipment is run to failure rather than maintained preventively.
Primary TPM tool to eliminate it: Autonomous Maintenance (AM) + Planned Maintenance (PM). Operators learn to detect early warning signs; maintenance teams shift from reactive to scheduled.
GreenDot field observation: In our experience with metal fabrication and engineering clients in Gujarat, breakdown loss is the most visible loss but rarely the highest cost loss. Plants that reduce breakdown frequency by 70% through PM schedules typically recover 8–12 OEE percentage points in Availability alone.
Loss 2: Setup & Adjustment Loss
What it is: Time lost while changing over from one product to another — adjusting, calibrating, trialling, and waiting for first good piece approval.
How it shows up: A plastic injection moulding machine takes 3 hours to change from one mould to another. A pharmaceutical tablet press takes 2 hours to clean, set up, and validate for a new product.
OEE impact: Reduces Availability.
Primary TPM tool: SMED (Single Minute Exchange of Die) — the systematic conversion of internal setup activities to external ones, reducing changeover time by 30–70%.
Real Case Study — Siloxane Aggrandize Innovative Industries, Valsad, Gujarat
Siloxane Aggrandize Innovative Industries is a specialised polymer compounding manufacturer based in Valsad, Gujarat. Founded by Mr. Rakesh Desai, the company operates with a 15,000 MT annual production capacity, manufacturing customised thermoplastic elastomers (TPE), TPR compounds, and specialty polymer granules for injection moulding, extrusion, blow moulding, and roto-moulding applications.
With a diverse product range requiring frequent colour and compound changeovers between production runs, Setup & Adjustment Loss (Loss #2) was a significant constraint on output capacity. Each changeover between polymer grades or colour specifications consumed substantial machine time — time that was completely non-value-adding.
GreenDot implemented a structured SMED programme at the Siloxane facility. By separating internal changeover tasks (machine must be stopped) from external tasks (can be prepared while machine is running), standardising the sequence of each changeover step, and training operators on the revised procedure, changeover time was significantly reduced.
Result: Production throughput improved, colour changeover consistency increased, and the plant was able to schedule more production runs per shift without adding equipment or manpower.
GreenDot service used: SMED / Changeover Reduction under TPM Pillar — Focused Improvement
Loss 3: Cutting Blade / Tool Change Loss
What it is: Time lost when a cutting tool, grinding wheel, drill bit, or similar consumable reaches the end of its usable life and must be replaced during production.
How it shows up: A CNC machining centre stops every 45 minutes for tool indexing. A press tool breaks mid-run. A blade wears faster than expected due to material variation.
OEE impact: Reduces Availability.
Primary TPM tool: Predictive tool life monitoring, standardised tool change schedules, quick-change tooling systems.
Indian context: Most common in precision engineering, auto component, and metal cutting industries — Rajkot, Pune, Chennai, Coimbatore tool rooms.
Loss 4: Startup Loss
What it is: Waste of time, material, and product quality during the startup phase of a machine or production run — before stable, good-quality production is achieved.
How it shows up: A pharmaceutical granulation line takes 20 minutes of off-spec output before granule size stabilises. An injection moulding machine produces 15 rejected parts during warmup. A chemical batch reactor takes 45 minutes to reach process temperature.
OEE impact: Reduces Availability (time) and Quality (startup rejects).
Most critical in: Pharma, chemical, glass, rubber — any industry with process-intensive startup sequences.
Primary TPM tool: Standardised startup procedures, operator training, process parameter sheets.
Loss 5: Minor Stoppage & Idling Loss
What it is: Brief, frequent interruptions to production — machine jams, sensor trips, conveyor blockages, part misfeeds — that each last only seconds or minutes but collectively add up to significant lost time.
How it shows up: A packaging line stops 12 times per shift for sensor resets, each time losing 3 minutes. Total: 36 minutes lost per shift — nearly invisible on a shift report, but 3 hours per day.
OEE impact: Reduces Performance Rate.
Why it is underreported: Minor stoppages are rarely logged individually. Most Indian plants capture planned downtime and major breakdowns but miss the accumulated cost of minor stoppages entirely.
Primary TPM tool: Focused Improvement (Kobetsu Kaizen) — systematic elimination of the root causes of minor stoppages through 5-Why analysis.
Loss 6: Reduced Speed Loss
What it is: The gap between a machine’s designed speed and the speed at which it actually runs. Even when a machine is running and producing, if it runs below its ideal cycle time, efficiency is lost.
How it shows up: A bottling line is rated for 200 bottles/minute but runs at 160. An extrusion line runs at 70% of rated speed because higher speed causes dimensional variation.
OEE impact: Reduces Performance Rate.
Primary TPM tool: Focused Improvement — identifying whether speed is limited by mechanical wear, process instability, operator habit, or quality constraints.
GreenDot observation: Speed loss is one of the most underestimated losses in Indian manufacturing. Plants often accept a “safe” running speed that is far below the designed capacity, not realising the cumulative output impact across shifts and months.
Loss 7: Defects & Rework Loss
What it is: Time and material lost when products do not meet quality standards and must be reworked or scrapped.
How it shows up: 2% of castings require regrinding. 1.5% of tablets fail weight check. 3% of moulded parts have sink marks and are rejected.
OEE impact: Reduces Quality Rate.
Primary TPM tool: Quality Maintenance (Hinshitsu Hozen) — establishing equipment conditions that guarantee zero defects at the source.
Real Case Study — New India Cuprotec, Gujarat (Transcribed from GreenDot client testimonial — Maintenance Head)
New India Cuprotec manufactures copper bus bars for multinational electrical companies. Their production involves frequent colour coding changes between product grades — each colour change requiring a complete cleaning and changeover of the production line.
Before GreenDot’s TPM intervention, the production department was running a variable, inconsistent monthly output — typically 15 to 18 production runs per month — with significant variation in quality between runs. Changeover between colour specifications was unstructured, and output quality during startup after a colour change was a consistent source of defects.
Following GreenDot’s TPM programme — which included structured colour changeover procedures, operator training on standard sequences, and visual management systems — the team achieved a stable, consistent output rhythm.
Verified results (from client testimonial):
| Metric | Before GreenDot TPM | After GreenDot TPM |
|---|---|---|
| OEE | 50% | 59% |
| Availability Rate | 50% | 59% |
| Performance Rate | 73% | 80% |
| Quality Rate | 73% | 80% |
| Daily Production | 15–16 tonnes | 25–27 tonnes |
| Monthly Production Runs | 15–18 (variable) | 24 (stable average) |
| Colour Change Quality | Inconsistent, defects at startup | Consistent, standardised |
“Our monthly 24-run average is now running consistently. The colour change process and level variation has improved significantly — the change is clearly visible.” — Maintenance Head, New India Cuprotec
GreenDot services used: TPM Implementation — Quality Maintenance + Focused Improvement
Loss 8: Planned Shutdown Loss
What it is: Scheduled downtime for planned maintenance, cleaning, regulatory inspections, or statutory shutdowns. Although planned, this time still represents lost production capacity and must be tracked and minimised.
How it shows up: Annual statutory shutdown. Weekly planned maintenance window. Cleaning-in-place (CIP) cycles in food and pharma.
OEE impact: Reduces Availability (though some OEE calculations exclude planned shutdowns — JIPM includes them in the 16 losses for complete transparency).
Indian context: Particularly significant in chemical and pharmaceutical plants, where statutory shutdown requirements from PESO, CPCB, or GMP guidelines are non-negotiable. The goal is not to eliminate planned shutdowns but to minimise their duration and maximise productive use of the window.
HUMAN / LABOUR LOSSES (Losses 9–13)
These losses are measured through OPE and tracked at the operator or line level. They are the most overlooked category in Indian SMEs.
Loss 9: Management Loss
What it is: Time lost by operators waiting for decisions, instructions, materials, approvals, or information that should have been available — but wasn’t, due to management system failures.
How it shows up: An operator waits 25 minutes for a supervisor to approve a process change. A line stops because the production schedule was not communicated. Material is not ready because procurement was not informed in time.
OPE impact: Reduces labour utilisation.
Why it matters in India: Management loss is the single most underreported loss in Indian manufacturing. It does not show up on any machine log, OEE report, or downtime record — yet in our experience, it accounts for 15–25% of total human efficiency loss in plants with poor communication systems.
Primary TPM tool: Education & Training pillar + Daily Management System (visual boards, shift handover meetings, escalation protocols).
Loss 10: Motion Loss
What it is: Unnecessary physical movement by operators that does not add value — walking to fetch tools, searching for parts, bending awkwardly, reaching unnecessarily.
How it shows up: An operator walks 40 metres per cycle to collect components that could be positioned at the workstation. A quality inspector walks to a distant gauge room for every check.
OPE impact: Reduces effective working time.
Primary TPM tool: 5S + Workplace Design (motion economy analysis, workstation optimisation).
Loss 11: Line Organisation Loss
What it is: Imbalance in the production line — some workstations are overloaded while others wait. The line’s output is constrained by its slowest station (the bottleneck).
How it shows up: In a 6-station assembly line, station 3 takes 45 seconds while all others take 30 seconds. The entire line runs at the rate of station 3, leaving all other operators idle for 15 seconds per cycle.
OPE impact: Reduces effective utilisation of all non-bottleneck operators.
Primary TPM tool: Line Balancing + Value Stream Mapping.
Loss 12: Transportation & Logistics Loss
What it is: Time lost moving materials, work-in-progress, or finished goods between locations unnecessarily — transportation that does not add value to the product.
How it shows up: WIP travels 300 metres between machining and inspection. Finished goods are moved three times before final storage. Forklifts make unnecessary trips due to poor layout.
OPE impact: Reduces productive utilisation of both operators and material handling equipment.
Primary TPM tool: Plant Layout Improvement + 5S + Value Stream Mapping.
Loss 13: Measurement & Adjustment Loss
What it is: Time spent by operators making repeated measurements, adjustments, and rechecks to maintain quality — time that would not be needed if the process were in proper control.
How it shows up: A machinist measures every 5th part and adjusts the CNC offset after every 3rd part. A chemical reactor operator manually checks and adjusts temperature every 15 minutes because the control system is not calibrated.
OPE impact: Reduces net productive output per operator hour.
Primary TPM tool: Quality Maintenance — establishing process capability (Cpk) so that the process produces within specification consistently, without constant manual intervention.
RESOURCE CONSUMPTION LOSSES (Losses 14–16)
These losses directly impact material costs, energy bills, and tooling spend. In Indian manufacturing, they are often worth more money than equipment losses.
Loss 14: Yield / Material Loss
What it is: Raw material consumed in excess of the theoretical requirement — due to startup scrap, process inefficiency, over-specification, or poor handling.
How it shows up: A polymer compounder uses 105 kg of raw material to produce 100 kg of finished compound. A foundry loses 8% of metal as sprues and runners that are not efficiently recycled.
Cost impact: In materials-intensive industries (chemicals, polymers, metals), yield loss of even 2–3% can represent crores of rupees annually.
🏭 Real Case Study — Siloxane Aggrandize Innovative Industries, Valsad, Gujarat
For a polymer compounder like Siloxane — where raw material cost represents the dominant portion of total production cost — yield loss and material loss are directly linked to profitability. The company’s diverse product range (TPE, TPR, elastomer blends, specialty granules) requires precise formulation and compounding; any deviation in raw material ratios directly impacts yield and product quality.
GreenDot’s SMED and process standardisation work at Siloxane directly addressed material loss alongside changeover time reduction. By standardising compound formulations, reducing startup scrap during colour and grade changeovers, and implementing structured operator procedures, material yield improved alongside output consistency.
“When changeover is done right, you don’t just save time — you save material. Every kilogram of off-spec compound at startup is a direct cost. Standardising the changeover sequence reduced our startup waste significantly.” — Paraphrased from GreenDot field report, Siloxane Aggrandize Innovative Industries
Loss 15: Energy Loss
What it is: Energy (electricity, fuel, steam, compressed air) consumed without producing value — during idle running, inefficient processes, poor insulation, compressed air leaks, or oversized equipment.
How it shows up: A 200-tonne injection moulding machine idles at full power during breaks. Compressed air leaks waste 20–30% of compressor output. Furnaces run without load during minor stoppages.
Cost context for India: Energy typically accounts for 8–15% of production cost in Indian manufacturing. A 10% reduction in energy loss translates directly to bottom-line savings — often ₹5–25 lakh per year for a mid-sized plant.
Primary TPM tool: Focused Improvement on energy monitoring + Autonomous Maintenance (operators trained to switch off equipment during non-production periods).
Loss 16: Die / Tool / Jig Loss
What it is: Cost and time lost due to premature die wear, jig damage, tool breakage, or excessive tooling consumption beyond the standard life expectation.
How it shows up: A die that should last 50,000 shots fails at 32,000 due to inadequate cooling maintenance. A jig wears out of tolerance due to lack of inspection, causing a batch of defective parts.
Cost impact: Tooling costs are often treated as a fixed overhead in Indian plants, when in reality they are highly variable based on maintenance quality.
Primary TPM tool: Planned Maintenance — tool life tracking, die inspection schedules, condition-based replacement.
The 16 Losses vs. The 6 Big Losses: What Is the Difference?
Many plant managers know the 6 Big Losses from OEE training. Here is how they relate to the 16 Major Losses:
| 6 Big Losses (OEE Framework) | Equivalent in 16 Major Losses | Category |
|---|---|---|
| Equipment Failure / Breakdown | Loss 1: Breakdown Loss | Equipment |
| Setup & Adjustment | Loss 2: Setup & Adjustment Loss | Equipment |
| Idling & Minor Stoppages | Loss 5: Minor Stoppage & Idling Loss | Equipment |
| Reduced Speed | Loss 6: Reduced Speed Loss | Equipment |
| Process Defects | Loss 7: Defects & Rework Loss | Equipment |
| Reduced Yield / Startup Loss | Loss 4: Startup Loss | Equipment |
| (Not in 6 Big Losses) | Losses 8–16 (8 additional losses) | Human & Resource |
The key insight: The 6 Big Losses cover only Equipment losses and only affect OEE. The 16 Major Losses add 8 more losses across human performance and resource consumption — making it a far more complete picture of plant efficiency.
A plant that achieves 85% OEE (world-class) but ignores human losses and resource losses can still be significantly below its potential profitability.
Which Losses Are Most Common in Indian Manufacturing? (Sector Guide)
Based on GreenDot’s 25+ years of plant assessments across Gujarat, Maharashtra, and Rajasthan:
| Industry Sector | Top 3 Losses Typically Found | Why |
|---|---|---|
| Auto Components (Rajkot, Pune, Faridabad) | Breakdown (#1), Setup (#2), Motion (#10) | High-mix, high-speed machining; tool wear; operator movement |
| Pharmaceuticals (Ahmedabad, Vapi, Baddi) | Startup (#4), Planned Shutdown (#8), Measurement & Adjustment (#13) | GMP compliance; batch changeover; process validation requirements |
| Chemicals (Vapi, Ankleshwar, Vadodara) | Energy (#15), Yield (#14), Planned Shutdown (#8) | Continuous process; energy-intensive; regulatory shutdowns |
| Polymer / Plastics (Valsad, Daman, Silvassa) | Setup (#2), Yield (#14), Minor Stoppages (#5) | Frequent grade/colour changes; startup scrap; feeding issues |
| Textiles (Surat, Ahmedabad) | Speed (#6), Yield (#14), Line Organisation (#11) | Speed restrictions due to yarn quality; material waste; line imbalance |
| FMCG / Packaging | Minor Stoppages (#5), Line Organisation (#11), Transportation (#12) | High-speed lines; multi-SKU production; material flow issues |
| Electrical Equipment (Vapi, Mumbai, Pune) | Management (#9), Motion (#10), Setup (#2) | Custom/batch production; operator movement; job change time |
Real Case Study: Lean Manufacturing Across Equipment, Human & Resource Losses — FCG Hi-Tech Pvt. Ltd., Vapi, Gujarat
Company: FCG Hi-Tech Pvt. Ltd., Vapi, Gujarat Industry: Flameproof electrical equipment — junction boxes, switchgears, flameproof LED lighting, control panels for hazardous locations (oil & gas, petrochemical, pharmaceutical) Size: ~225 employees Certifications: CMRI, BIS, PESO, ATEX, IECEx Customers: Pidilite, Lupin and other major Indian industrial groups
FCG Hi-Tech began a GreenDot Lean Manufacturing project on 2nd July 2018. By 31st October 2018 — in just 4 months — the results were documented by Mr. Hiren Patel, Managing Director:
Verified results (transcribed from client testimonial video):
| Area | Result |
|---|---|
| Casting Production Output | Increased by 20% |
| Overall Delivery Time | Improved by 2 weeks |
| Total Production Output | Increased by 50% |
| Assembly Time per Job | Reduced from 3 days to 1 day |
| Machine Shop Monthly Overtime Cost | Reduced to ₹80,000/month (from significantly higher) |
| Annualised Overtime Saving | Approximately ₹10 lakh per year |
“Within this time we have improved many things through Lean management. My casting production we have increased up to 20 percent. Overall delivery time we have increased [improved] to two weeks. We have increased the production by 50 percent. The Machine Shop overtime — people used to work overnight — that monthly we have come down to ₹80,000. So yearly we might be saving approximately ₹10 lakhs. The overall production of my assembly time has reduced from three days to one day. Still around seven months are left with the Lean manufacturing project — I am sure we might achieve more good results.” — Hiren Patel, Managing Director, FCG Hi-Tech Pvt. Ltd. Watch the full testimonial
Which of the 16 losses did GreenDot address at FCG Hi-Tech?
| Loss Addressed | Category | Result |
|---|---|---|
| Loss 2: Setup & Adjustment | Equipment | Faster job changeover; assembly time 3 days → 1 day |
| Loss 5: Minor Stoppages | Equipment | Smoother casting production; 20% output increase |
| Loss 6: Reduced Speed | Equipment | 50% overall production increase |
| Loss 9: Management Loss | Human | Improved delivery planning; 2-week delivery improvement |
| Loss 10: Motion Loss | Human | Overtime reduction; machine shop efficiency |
| Loss 11: Line Organisation | Human | Assembly line rebalanced; 3 days → 1 day |
GreenDot service: Lean Manufacturing Implementation — 4-month structured programme
How to Track the 16 Losses in Your Plant: A Practical Guide
Knowing the 16 losses is only the first step. Here is how GreenDot recommends Indian manufacturers start tracking them:
Step 1: Assign Loss Ownership
Each loss must have an owner:
- Equipment Losses (1–8): Maintenance Manager + Production Supervisor
- Human Losses (9–13): Production Manager + HR / IE
- Resource Losses (14–16): Plant Manager + Purchase / Energy team
Step 2: Start with a Loss & Waste Analysis (LWA) Log
For each shift, operators and supervisors record:
- Which losses occurred
- Duration / quantity
- Root cause (brief)
- Action taken
Do not try to track all 16 from day one. Begin with the top 3–4 losses most visible in your plant.
Step 3: Track Loss-Specific KPIs
| Loss Category | KPI to Track | Measurement Frequency |
|---|---|---|
| Breakdown (#1) | MTBF (Mean Time Between Failures), MTTR | Daily |
| Setup (#2) | Average changeover time per machine | Per changeover |
| Minor Stoppages (#5) | Stoppage frequency per shift | Per shift |
| Speed (#6) | Actual vs. ideal cycle time | Daily |
| Defects (#7) | Defect PPM or rejection % | Daily |
| Management (#9) | Waiting time per shift | Weekly |
| Energy (#15) | kWh per tonne of output | Monthly |
| Yield (#14) | Material yield % | Per batch / per shift |
Step 4: Plot Losses on an OEE / OPE Dashboard
Visualise your losses on a simple weekly chart. Any loss consistently in your top 3 becomes your next Kaizen or Focused Improvement project.
Step 5: Prioritise Using a Loss Matrix
| Loss | Frequency | OEE/Cost Impact | Ease of Fix | Priority |
|---|---|---|---|---|
| Breakdown | High | High | Medium | 1st |
| Setup & Adjustment | High | High | High (SMED) | 2nd |
| Minor Stoppages | High | Medium | High | 3rd |
| Management Loss | Medium | High | Medium | 4th |
| Energy Loss | Low | High | Medium | 5th |
| Reduced Speed | Medium | Medium | Low | 6th |
(Priorities will vary by plant — this is a starting framework, not a fixed rule.)
How to Reduce the 16 Losses: TPM Pillar Mapping
Each of the 16 losses has a corresponding TPM pillar or tool. This table connects the problem to the solution:
| Loss | Primary TPM Tool / Pillar |
|---|---|
| 1: Breakdown | Planned Maintenance + Autonomous Maintenance |
| 2: Setup & Adjustment | SMED (Focused Improvement) |
| 3: Tool Change | Predictive Tooling + Planned Maintenance |
| 4: Startup Loss | Standardised Work + Quality Maintenance |
| 5: Minor Stoppages | Focused Improvement (5-Why, Poka-Yoke) |
| 6: Reduced Speed | Focused Improvement + Equipment Restoration |
| 7: Defects & Rework | Quality Maintenance (Hinshitsu Hozen) |
| 8: Planned Shutdown | Planned Maintenance (shutdown optimisation) |
| 9: Management Loss | Education & Training + Daily Management System |
| 10: Motion Loss | 5S + Workplace Design |
| 11: Line Organisation | Line Balancing + VSM |
| 12: Transportation | Layout Improvement + 5S |
| 13: Measurement & Adjustment | Quality Maintenance (SPC, Cpk improvement) |
| 14: Yield Loss | Quality Maintenance + Standardised Work |
| 15: Energy Loss | Focused Improvement + AM (switch-off discipline) |
| 16: Die / Tool / Jig | Planned Maintenance (tool life tracking) |
TPM Readiness Checklist for Indian Manufacturers
Before starting a 16-loss reduction programme, answer these questions honestly:
- Do you currently measure OEE on your key equipment?
- Do you have a structured Planned Maintenance schedule?
- Are your operators trained to detect abnormalities in their machines?
- Do you track changeover time per machine or line?
- Do you have a daily production meeting with loss review?
- Do you track material yield per batch or shift?
- Do you know your top 3 losses by frequency and cost?
- Is there a visual management system on the shop floor?
Score 0–3: Your plant is in reactive mode. Start with 5S and Autonomous Maintenance before attempting full 16-loss tracking. Score 4–6: You have a foundation. A structured TPM Loss Analysis will identify your highest-impact opportunities quickly. Score 7–8: You are ready for a full 16-loss reduction programme with measurable OEE targets.
Frequently Asked Questions: 16 Major Losses in TPM
Q1. What is the difference between the 16 major losses and the 6 big losses? The 6 Big Losses are a subset of the 16 Major Losses. They cover only the 6 most impactful equipment losses that affect OEE. The 16 Major Losses add 5 human/labour losses and 3 resource/material losses, giving a complete picture of plant efficiency including people and costs — not just machines.
Q2. Which of the 16 losses affects OEE the most? It depends on your industry and plant. In most Indian SMEs, Breakdown Loss (#1) and Setup Loss (#2) are the biggest OEE killers. However, in high-volume continuous production, Minor Stoppages (#5) and Reduced Speed (#6) often have a larger cumulative impact because they are harder to see and rarely logged.
Q3. Can a plant with high OEE still be losing money through the 16 losses? Yes. A plant with 82% OEE can still lose significant money through Management Loss (#9), Energy Loss (#15), and Yield Loss (#14) — none of which appear in the OEE formula. This is why the full 16-loss framework exists.
Q4. What is Management Loss in TPM and why is it important? Management Loss (#9) is time operators spend waiting — for instructions, materials, approvals, or decisions — due to failures in the management system. It is one of the most costly and least tracked losses in Indian manufacturing because it does not appear on any machine log or downtime report. It requires a Daily Management System to measure and eliminate.
Q5. How long does it take to see results from a 16-loss reduction programme? Based on GreenDot’s experience with Indian manufacturers: visible results (OEE +5 to +10 percentage points) within 3–6 months. Significant transformation (OEE +15 to +25 points) within 12–24 months. FCG Hi-Tech achieved a 50% production increase and ₹10 lakh annual overtime saving in just 4 months of Lean/TPM implementation.
Q6. Do small Indian plants (50–200 employees) need to track all 16 losses? No — not initially. Start with the top 3–5 losses most visible in your plant. For most Indian SMEs with 50–200 employees, the priority sequence is: Breakdown → Setup → Minor Stoppages → Management Loss → Energy Loss. Add more losses as your measurement capability matures.
Q7. What is OPE and how is it different from OEE? OEE (Overall Equipment Effectiveness) measures machine efficiency. OPE (Overall Plant Effectiveness) extends this to include labour utilisation: OPE = OEE × Labour Utilisation Rate. The 16 Major Losses framework measures both — Equipment Losses affect OEE, Human Losses affect OPE.
Q8. Which TPM pillar is most effective for reducing human losses (9–13)? The Education & Training pillar addresses the root cause of most human losses — lack of skill, knowledge, or system. Combined with a Daily Management System (visual boards, shift meetings, clear SOPs), human losses can be reduced by 40–60% within 6 months. 5S addresses Motion Loss (#10) and Transportation Loss (#12) directly.
Q9. Is SMED the only tool for reducing Setup & Adjustment Loss? SMED (Single Minute Exchange of Die) is the most powerful tool for dramatic changeover reduction (30–70% reduction typical). However, it works best alongside standardised work instructions, shadow boards for tools, and operator training. GreenDot’s SMED implementations at polymer and manufacturing plants in Gujarat have consistently achieved significant changeover reductions through this combination.
Q10. How do I know which of the 16 losses to tackle first? Prioritise based on: (1) frequency — how often does this loss occur? (2) duration — how much time/cost does each occurrence represent? (3) ease of fix — how much investment is required to reduce it? The loss that is frequent, costly, and relatively easy to fix should always be your first project. GreenDot’s Loss Assessment identifies your plant’s top losses within 2–3 days of plant observation.
Summary: The 16 Major Losses — What to Remember
- The 16 Major Losses is the JIPM framework that maps every source of inefficiency in a manufacturing plant — across machines, people, and resources.
- They are divided into 3 categories: Equipment Losses (OEE), Human Losses (OPE), and Resource Losses (cost).
- Equipment Losses affect OEE through Availability, Performance, and Quality.
- Human Losses are the most overlooked category in Indian SMEs — particularly Management Loss.
- Resource Losses (energy, material, tooling) often represent the highest financial impact per year.
- The 16 losses are not a checklist to complete — they are a continuous measurement system to run permanently.
- Indian manufacturers who systematically reduce their top 5–6 losses typically achieve 15–25% OEE improvement within 18 months.
Work with GreenDot: Start with a Loss Assessment
Not sure which of the 16 losses is hurting your plant most?
GreenDot Management Solutions has helped 1,000+ Indian manufacturers identify and eliminate their biggest productivity losses through structured TPM and Lean implementations. Our clients include FCG Hi-Tech (Vapi), New India Cuprotec (Gujarat), Siloxane Aggrandize Innovative Industries (Valsad), Atul Limited, Castrol, Pidilite, UPL, and Eris Life Sciences.
We offer a structured TPM Loss Assessment for manufacturing plants across Gujarat, Maharashtra, and Rajasthan — identifying your top losses, their cost impact, and a prioritised action plan.