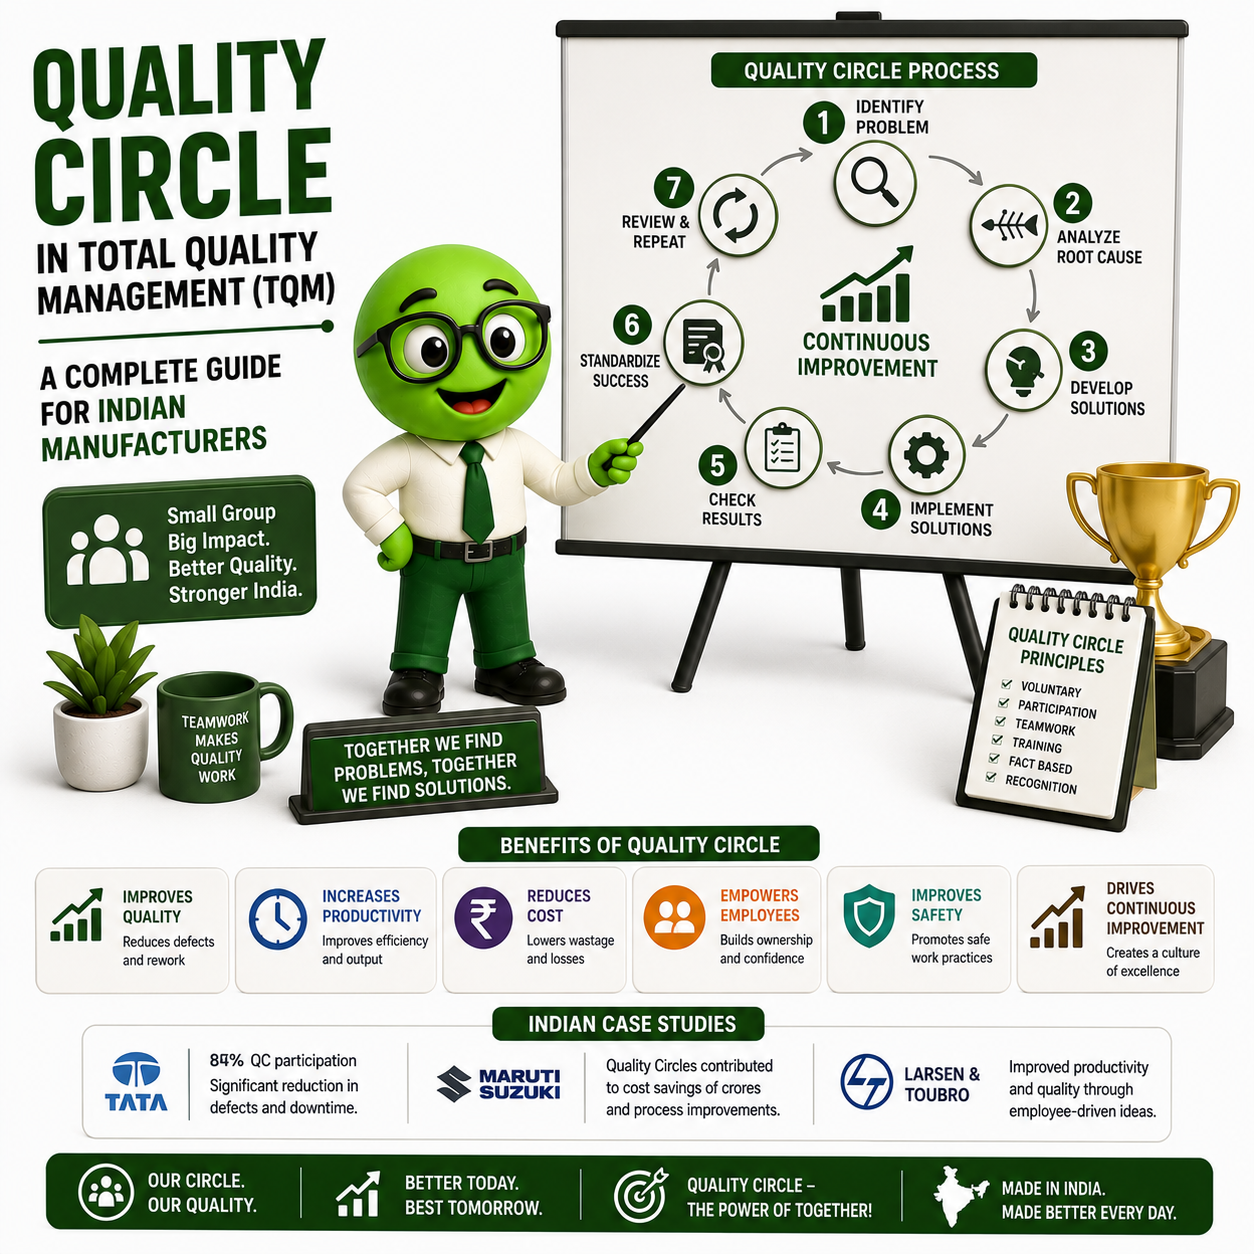

What is a Quality Circle?
A Quality Circle (QC) is a small, voluntary group of employees — typically 6 to 10 people from the same department or work area — who meet regularly to identify problems in their workplace, analyse their root causes using structured tools, and implement permanent solutions.
The concept was developed in Japan in 1962 by Dr. Kaoru Ishikawa at Nippon Wireless and Telegraph Company. It was built on a simple but powerful belief: the people who do the work understand it best. They are, therefore, best placed to improve it — provided they are given the right tools, training, and management support.
In India, Quality Circles were formally introduced in 1982 through the Quality Circle Forum of India (QCFI). Today, QCFI runs the National Convention on Quality Circles (NCQC) — one of the world’s largest annual quality conventions — and has facilitated millions of QC projects across Indian industry, particularly in automotive, chemicals, pharmaceuticals, and textiles.
Quality Circles and Total Quality Management (TQM)
Total Quality Management (TQM) is a management philosophy that aims to achieve long-term customer satisfaction through the continuous improvement of every process, product, and service in an organisation — involving every employee, at every level.
Quality Circles are not just compatible with TQM — they are one of its most practical delivery mechanisms. Here is how they fit:
| TQM Principle | How Quality Circles Deliver It |
|---|---|
| Customer focus | QC teams solve defect and rejection problems that directly affect product quality reaching the customer |
| Employee involvement | QC is entirely employee-driven — operators and technicians lead the improvement |
| Process approach | QC uses data and structured tools to analyse the process, not blame the person |
| Continuous improvement | Each completed QC project feeds into the next; the cycle never stops |
| Evidence-based decisions | QC tools (Pareto, fishbone, control charts) make every conclusion data-backed |
| Leadership commitment | Management sponsors and recognises QC teams — sending a clear signal about priorities |
In practical terms: TQM sets the philosophy and the direction. Quality Circles are the engine that moves the organisation forward, one problem at a time, at the shop-floor level.
Quality Circle Team Structure: Roles and Responsibilities
One of the most common reasons Quality Circles fail in India is poor team formation. Here is the standard structure that works:
| Role | Who | Responsibilities |
|---|---|---|
| Circle Leader | Senior operator or team lead | Facilitates meetings, assigns tasks, keeps the project on track |
| Deputy Leader | Operator or technician | Supports the leader, takes charge in their absence |
| Members | 4–8 operators/technicians from the same work area | Participate in data collection, analysis, and implementation |
| Facilitator | Quality manager, HR, or external consultant | Coaches the team on tools and process; does not solve problems for them |
| Management Champion | Plant head, production manager, or senior director | Provides resources, removes barriers, and formally presents and approves solutions |
Key principle: The facilitator guides — they do not lead. The team must own the problem and the solution. When management takes over problem-solving, the Quality Circle stops being a Quality Circle and becomes a management task force.
What Happens in a Quality Circle Meeting?
A standard Quality Circle meeting runs 45–60 minutes, once per week. Here is a typical agenda that works in Indian manufacturing plants:
Standard QC Meeting Agenda
- Opening (5 min) — Attendance, previous minutes, action status
- Data review (10 min) — What data was collected since last meeting? What does it show?
- Analysis work (20 min) — Apply the current tool (fishbone, Pareto, etc.) to the data
- Decision and action (15 min) — What is the next step? Who does what by when?
- Closing (5 min) — Record minutes, confirm next meeting date
Meetings should be held in the same location every week — ideally near the work area, not in a conference room far removed from the actual process. In Gujarat’s chemical and textile plants, teams often conduct meetings in Gujarati or Hindi, which is why local facilitation matters.
The 12-Step Quality Circle Problem-Solving Cycle
At Greendot, we use a structured 12-step framework to ensure that problems are solved permanently — not just patched:
| Step | Action | Key Output |
|---|---|---|
| 1 | Identify the problem | Problem list from the team |
| 2 | Select the project | Prioritised theme using Pareto or voting |
| 3 | Form the QC team | Named roles, signed charter |
| 4 | Study the current process | Process map / flowchart |
| 5 | Collect data | Check sheets, measurement records |
| 6 | Analyse root causes | Fishbone diagram, Why-Why analysis |
| 7 | Develop possible solutions | Brainstormed solution list |
| 8 | Select the best solution | Decision matrix with criteria weighting |
| 9 | Plan the implementation | Action plan with owner, date, and resource |
| 10 | Execute improvements | Pilot trial, then full implementation |
| 11 | Monitor and measure results | Before-vs-after comparison with data |
| 12 | Standardise and share | SOP update, horizontal deployment to other lines |
This is sometimes called the QC Story — a narrative arc that takes a problem from identification to permanent elimination, documented in a format that can be presented at internal reviews or at NCQC conventions.
The 7 Classic QC Tools — Explained for Plant Use
These seven tools form the foundation of Quality Circle problem-solving. Every team member should understand them:
| Tool | What It Does | When to Use It |
|---|---|---|
| Fishbone Diagram (Ishikawa) | Maps all possible causes of a problem across 6 categories (Man, Machine, Method, Material, Measurement, Environment) | Step 6 — Root cause analysis |
| Check Sheet | Structured form for collecting real-time data from the shop floor | Step 5 — Data collection |
| Control Chart | Tracks process output over time to detect if a process is stable or drifting | Step 11 — Monitoring after improvement |
| Histogram | Shows the distribution of data — reveals if a process is centred and within specification | Step 5 & 11 — Understanding variation |
| Pareto Chart | Bar chart showing which problems (or causes) account for 80% of the impact | Step 2 — Problem selection; Step 6 — Cause prioritisation |
| Scatter Diagram | Plots two variables to see if there is a relationship (e.g., temperature vs. defect rate) | Step 6 — Testing cause-and-effect hypotheses |
| Flowchart | Maps the steps in a process to identify where problems occur | Step 4 — Process study |
Greendot’s experience: In Gujarat’s chemical and packaging plants, the Fishbone Diagram and Pareto Chart are the two tools that generate the most breakthroughs — because most teams discover that 2–3 root causes account for over 75% of their defect volume. Fixing those changes everything.
The New 7 QC Tools — For Complex, Cross-Functional Problems
When problems involve multiple departments, strategic decisions, or planning uncertainty, the New 7 QC Tools (also called the 7 Management and Planning Tools) are more appropriate:
| Tool | What It Does | Best Use |
|---|---|---|
| Affinity Diagram | Groups large numbers of ideas or data into meaningful themes | Brainstorming sessions with many inputs |
| Interrelationship Digraph | Shows cause-and-effect links between multiple factors | Understanding complex, interconnected problems |
| Tree Diagram | Breaks a goal into progressively detailed action steps | Planning quality improvement projects |
| Matrix Diagram | Analyses relationships between two or more sets of factors | Comparing solutions against criteria |
| Matrix Data Analysis | Quantifies the matrix relationships for numerical comparison | Prioritising improvements by impact and effort |
| Arrow Diagram (PERT/CPM) | Plans project tasks and dependencies on a timeline | Scheduling QC implementation steps |
| PDPC (Process Decision Programme Chart) | Anticipates potential problems in a plan and prepares countermeasures | Risk-proofing the implementation plan |
In practice, most shop-floor Quality Circles primarily use the Classic 7. The New 7 are more commonly used by quality managers and cross-functional improvement teams.
Quality Circle vs. Kaizen vs. Six Sigma: Which Does Your Plant Need?
This is one of the most common questions GreenDot receives from plant managers in Gujarat and Maharashtra. Here is an honest comparison:
| Parameter | Quality Circle | Kaizen | Six Sigma |
|---|---|---|---|
| Primary focus | Quality problem-solving | Waste elimination and process improvement | Reducing process variation to near-zero defects |
| Team | 6–10 operators/technicians from one area | Cross-functional team, often with outsiders | Black Belt / Green Belt led project team |
| Problem scope | Localised, work-area specific | Any waste across any process | Large-scale, data-intensive, statistically significant problems |
| Duration | 3–6 months per project | 3–5 days (Kaizen event / blitz) | 4–6 months (DMAIC cycle) |
| Training required | Basic — 7 QC tools, meeting skills | Lean tools, waste identification | Statistical training (DOE, regression, hypothesis testing) |
| Cost to implement | Low | Low to medium | Medium to high |
| Best for | SMEs, operators-led improvement, culture building | Quick wins, line improvements, 5S integration | High-volume manufacturing with measurable defect rates |
| Employee involvement | Very high — operator-driven | High | Moderate — led by trained specialists |
| India MSME suitability | ★★★★★ | ★★★★☆ | ★★★☆☆ |
GreenDot’s recommendation: For most Indian SMEs in chemicals, textiles, engineering, and packaging — start with Quality Circles. They build the problem-solving culture that makes Kaizen events more effective and creates the data discipline that Six Sigma requires later. They are not mutually exclusive — they build on each other.
How Quality Circles Connect to ISO 9001:2015
If your plant is ISO 9001 certified or working towards certification, Quality Circles are not just useful — they are strategically aligned with multiple clauses:
| ISO 9001:2015 Clause | Quality Circle Contribution |
|---|---|
| Clause 7.2 — Competence | QC training builds documented competence in problem-solving tools |
| Clause 9.1 — Monitoring & Measurement | QC data collection provides objective evidence of process performance |
| Clause 10.1 — Improvement (General) | QC projects are formal improvement actions |
| Clause 10.2 — Nonconformity & Corrective Action | QC root cause analysis directly feeds the corrective action process |
| Clause 10.3 — Continual Improvement | Quality Circles are the primary mechanism for systematic, ongoing improvement |
When GreenDot audits plants for ISO 9001, one of the questions we ask is: “Show me how your employees participate in continual improvement.” A functioning Quality Circle program answers that question comprehensively — with documented projects, data, and results.
Why Quality Circles Fail in Indian Manufacturing — And How to Prevent It
Across 25+ years and 1,000+ client engagements across Gujarat, Maharashtra, and Rajasthan, Greendot has seen the same failure patterns repeat. Here they are — and how to prevent each one:
| Failure Reason | What It Looks Like | Prevention |
|---|---|---|
| Lack of management commitment | QC meetings are cancelled for production emergencies; no one from management attends presentations | Plant head must attend at least one meeting per month and publicly recognise teams |
| Treating QC as a compliance exercise | Teams are formed to satisfy ISO auditors, not to solve real problems | Choose genuine, high-pain problems that the team actually faces daily |
| Poor facilitator quality | Facilitator solves problems for the team instead of coaching them to solve it themselves | Train facilitators separately; their role is to ask questions, not provide answers |
| No recognition system | Teams complete projects and hear nothing — no acknowledgment, no reward | Create a formal QC presentation event (quarterly or annual); link to performance appraisal |
| Wrong team composition | Members are chosen by seniority, not by relevance to the problem area | Choose members who work directly with the process being improved |
| Skipping the data collection phase | Teams jump from problem to solution without evidence | Enforce the 12-step cycle; no team should present solutions without a Pareto chart |
| High attrition breaking continuity | Key QC members leave the plant mid-project | Document every step; cross-train at least two members to lead any circle |
| Language and literacy barriers | Tools are taught in English to workers who operate in Gujarati or Hindi | Conduct all training and meetings in the local language; use visual tools over text-heavy ones |
Quality Circles in Gujarat
Gujarat accounts for approximately 22% of India’s total manufacturing output. Its MSME density — particularly in Vapi, Ankleshwar, Dahej, Surat, Ahmedabad, Rajkot, and Bharuch — is among the highest in the country. Yet Quality Circle adoption remains low compared to Maharashtra’s automotive belt or Tamil Nadu’s auto-ancillary clusters.
Why the gap exists in Gujarat:
- Owner-managed culture means decisions are centralised — employees are not accustomed to problem-solving authority
- High workforce diversity (migrant workers from UP, Bihar, Rajasthan) creates language challenges in QC facilitation
- Chemical and textile plants have shift-based operations that make regular weekly meetings harder to schedule
- Many Gujarat SMEs have not yet connected QC to their ISO 9001 journey — they treat them as separate initiatives
How Greendot addresses this:
- We conduct all training and facilitation in Gujarati and Hindi as needed
- We design QC meeting schedules that fit shift patterns — not the other way around
- We connect QC project outcomes directly to the plant’s ISO 9001 corrective action register, so there is no duplication of effort
- We work with owner-managers to help them build a delegation mindset — because Quality Circles only work when employees genuinely feel empowered to act
We have implemented Quality Circle programs at plants across Vapi, Ankleshwar, Surat, Ahmedabad, Vadodara, Pune, Mumbai, Rajkot, and Bharuch — across industries including chemicals, textiles, pharmaceuticals, engineering fabrication, plastics, and packaging.
What Results Can You Expect?
Based on Greendot’s implementation experience with clients including Atul Limited, Castrol, Pidilite, UPL, Alltech Industries, and 150+ other organisations:
| Metric | Typical Improvement Range (6–12 months) |
|---|---|
| Defect / rejection rate | 30–60% reduction |
| Customer complaints related to quality | 25–45% reduction |
| Rework and scrap cost | 20–40% reduction |
| Employee participation in improvement | 3x to 5x increase |
| Number of documented improvement projects per year | 4–12 per circle |
| Employee morale and ownership | Qualitative but consistently reported as significantly improved |
These are not guaranteed figures — outcomes depend on management commitment, industry type, and the quality of facilitation. But they are representative of what is achievable in Indian manufacturing SMEs when the program is implemented correctly.
Frequently Asked Questions About Quality Circles
Q1: What is the difference between a Quality Circle and a task force? A task force is assembled by management to solve a specific problem identified by management. A Quality Circle is formed by employees themselves to solve problems they experience in their own work area. The ownership — and therefore the motivation — is fundamentally different.
Q2: How many Quality Circles should a plant have? There is no fixed number. A plant with 200 workers might run 5–8 circles simultaneously — one per major work area or department. The constraint is not space or budget; it is the capacity of your facilitators to support the teams properly.
Q3: Is a Quality Circle program expensive to run? The direct costs are minimal — training materials, meeting time, and facilitation. The indirect cost is management time for reviews and recognition events. Most Greendot clients recover the full program cost within the first 2–3 completed projects, through defect reduction and rework savings.
Q4: Can Quality Circles work in non-manufacturing environments? Yes. Quality Circles were originally developed for manufacturing, but QCFI has documented successful implementations in hospitals, banks, educational institutions, and service companies. The tools remain the same; the problems look different.
Q5: Does a Quality Circle need to be voluntary? Strictly speaking, yes — voluntary participation is one of the founding principles. In practice, most Indian plants start with a pilot group of enthusiastic volunteers, demonstrate results, and then find that participation grows organically. Forced participation almost always produces compliance, not genuine improvement.
Q6: What is the Quality Circle Forum of India (QCFI)? QCFI is a national body established in 1982 to promote Quality Circles across Indian industry. It has chapters in major cities including Ahmedabad, Mumbai, Pune, Chennai, and Bangalore. QCFI also organises the National Convention on Quality Circles (NCQC), where teams present their best projects competitively — an excellent motivation tool for your teams.
Q7: How does a Quality Circle relate to 5S? 5S creates the stable, organised workplace that makes Quality Circle data collection reliable. When a workplace is disorganised, variation in quality data is partly caused by the disorganisation itself — not just the process. Greendot recommends implementing 5S first, then building Quality Circles on that foundation. Read our complete guide: What is 5S Methodology? A Guide for Indian Manufacturers.
Q8: How long before we see results from a Quality Circle program? First results — typically the completion of a pilot project by one circle — usually appear within 3–4 months of proper launch. Systemic cultural change, where quality problem-solving becomes a normal part of how the plant operates, typically takes 12–18 months of consistent, supported implementation.
Q9: What happens after a Quality Circle completes a project? The team standardises the solution (updates SOPs, trains others), documents the project in a QC Story format, and then selects the next problem. Completed projects can be submitted to NCQC for external recognition. Greendot helps clients build an internal QC convention — an annual event where teams present to plant leadership — which dramatically boosts motivation.
Q10: Do we need an external consultant to implement Quality Circles? Not forever — but usually yes at the start. The most common reason in-house QC launches fail is that the facilitator was never trained to facilitate rather than solve. An experienced external consultant helps establish the right habits, trains internal facilitators, and provides an objective view of where the team’s analysis is going off track. Once the program is established (typically 12–18 months), internal teams can sustain it independently.
How Greendot Implements Quality Circles
Our Quality Circle implementation program is delivered in four structured phases:
Phase 1 — Awareness and Setup (Month 1)
- Management orientation: what QC is, what it requires, what to expect
- Selection of pilot area and pilot team
- Formation of team structure (Leader, Deputy, Members, Facilitator)
- Baseline data collection for the pilot problem
Phase 2 — Training and First Project (Months 2–3)
- Training in 7 Classic QC Tools — practical, shop-floor based, in local language
- Facilitated problem-solving for the first project
- Weekly QC meeting support from Greendot facilitator
Phase 3 — First Presentation and Expansion (Months 4–6)
- Pilot team presents completed project to plant leadership
- Results documented and verified
- Program expanded to 2–3 additional circles
- Internal facilitator training
Phase 4 — Sustenance and Internal Ownership (Months 6–18)
- Greendot moves from facilitator to advisor role
- Internal QC coordinator takes over meeting management
- Annual internal QC convention planning
- Optional: NCQC registration and participation
Ready to Start a Quality Circle Program at Your Plant?
If the same defects, customer complaints, or process failures keep coming back at your plant — Quality Circles are not just a tool. They are a culture shift that puts problem-solving where it belongs: with the people who know the work best.
Greendot has built this culture at over 1,000 organisations across India. We can build it at yours.