
A bearing manufacturer in Pune was struggling with a 22-day lead time for a product their customer wanted in 5 days. Management assumed the problem was machine capacity. A 3-day Value Stream Mapping exercise revealed something different: the actual machining time was 47 minutes. The other 21.5 days were waiting — in queues, in batches, in inspection backlogs, between departments.
This is what Value Stream Mapping reveals: the invisible system of delay, accumulation, and disconnection that lurks inside every factory and destroys competitiveness without appearing on any production report.
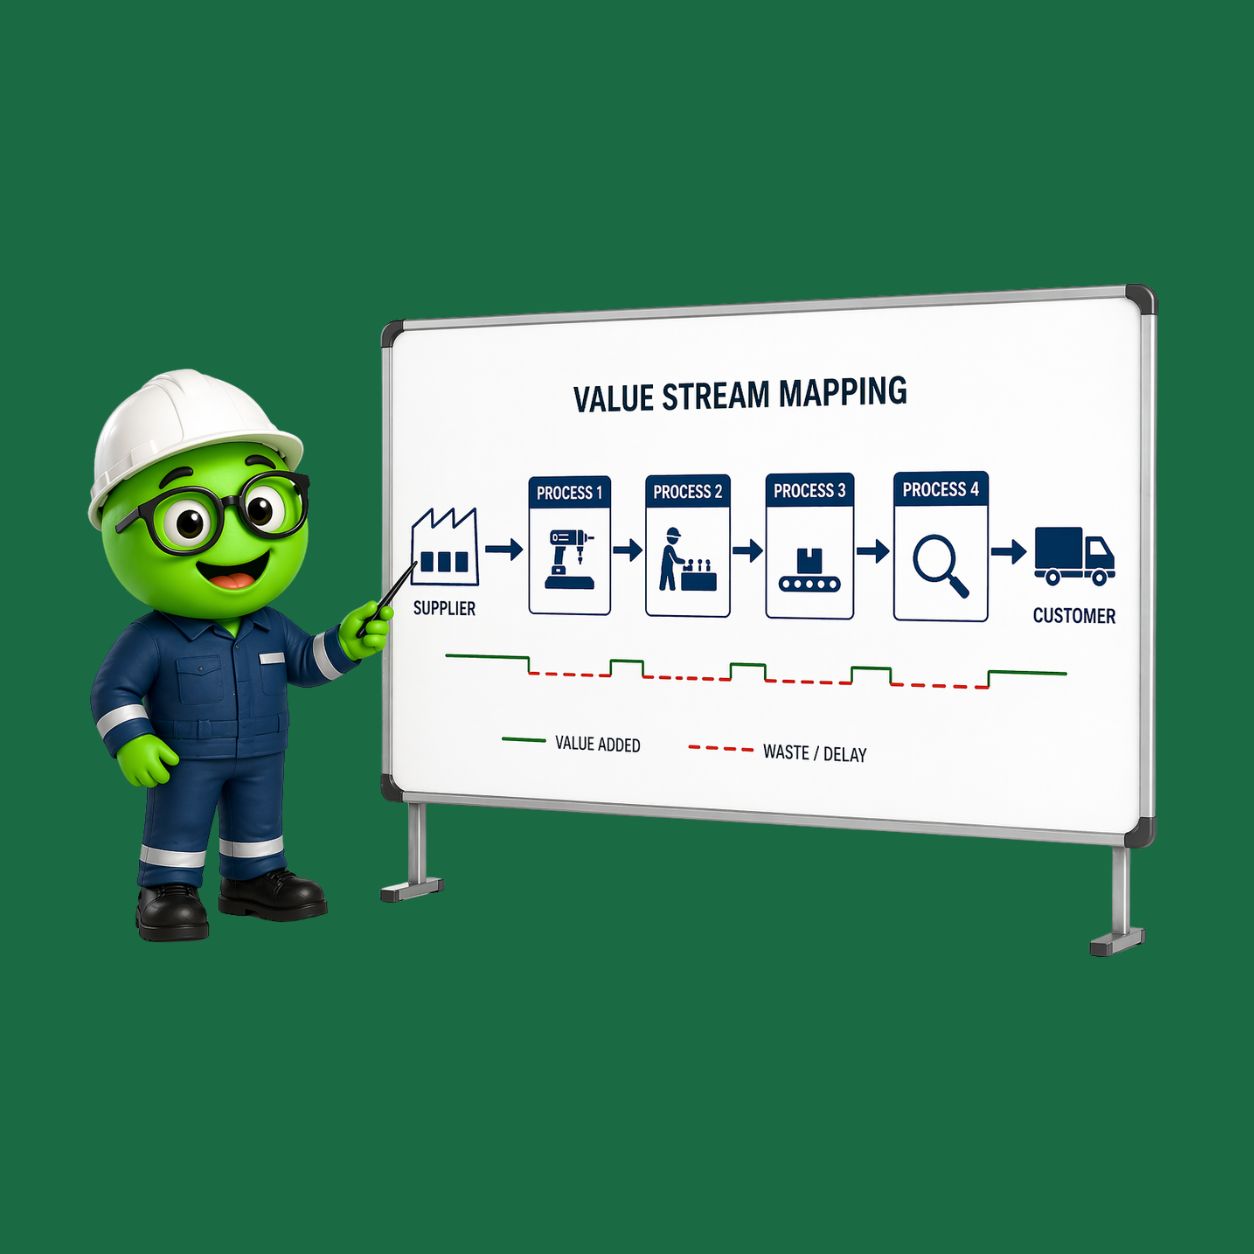
VSM is the foundational lean analysis tool — the starting point for any serious operational improvement program. It creates a visual map of every step in your production process, from customer order to delivery, showing material flow, information flow, inventory levels, waiting times, and process times simultaneously. The current-state map exposes waste with a clarity that no spreadsheet or management report can match. The future-state map becomes your improvement roadmap.
1. What Exactly Does VSM Map?
A Value Stream Map captures, for a specific product or product family:
- Every process step from raw material receipt to finished goods despatch
- The cycle time, changeover time, uptime, and operator count at each process step
- The inventory levels (in units and in days) sitting between each process step
- The push/pull signals that trigger production at each step
- The information flows — how production orders, schedules, and customer demands are communicated
- The lead time and value-added time across the entire value stream
The Most Important Number VSM Reveals:
Value-Added Ratio = Value-Added Time ÷ Total Lead Time × 100%. In most Indian MSME factories, this ratio is 1–5%. That means 95–99% of the time a product spends in your factory, nothing is actually being done to it. VSM makes this waste visible and actionable.
2. The VSM Process — Step by Step
| Step | Stage | What You Do |
| 1 | Select the Product Family | Choose one product or closely related product group that represents a significant portion of your revenue or your biggest delivery problem. VSM is done for one value stream at a time. |
| 2 | Walk the Value Stream | Physically walk the factory floor — from despatch back to goods receipt — following the product. Do not use historical data or computer records for the first pass. Observe reality. |
| 3 | Draw the Current State Map | Map every process step, inventory point, and information flow using standard VSM icons. Record cycle time, changeover time, uptime, operator count, and inventory levels at each point. |
| 4 | Calculate the Timeline | At the bottom of the map, draw a timeline showing value-added time (actual processing) vs. wait time at each step. Sum to get total lead time and total value-added time. |
| 5 | Identify Waste and Kaizen Bursts | Review the current state map and identify the 7 wastes (overproduction, waiting, transport, over-processing, inventory, motion, defects). Mark improvement opportunities with ‘kaizen burst’ symbols. |
| 6 | Design the Future State Map | Design the ideal future state — eliminating or reducing the wastes identified. Introduce pull systems, continuous flow, takt time-based production, and supermarkets where appropriate. |
| 7 | Build the Implementation Plan | Create a specific action plan with owner, deadline, and measurable target for each improvement initiative in the future state map. |
| 8 | Implement and Measure | Execute the improvement plan in defined phases. Measure lead time, inventory, and OEE at each milestone. When the future state is achieved, draw a new current state and repeat. |
3. The 8 Wastes VSM Identifies — With Indian Factory Examples
| Waste | Definition | Typical Indian Factory Example |
| Overproduction | Producing more than the next step or customer needs | Making large batches to ‘keep the machine busy’ — creating inventory nobody asked for |
| Waiting | People or materials waiting for the next step | WIP sitting between departments because the downstream machine is busy or under-staffed |
| Transport | Unnecessary movement of materials | Moving materials across the factory multiple times due to poor layout |
| Over-processing | Doing more work than the customer requires | Applying 3 quality checks where 1 would suffice; finishing to a tolerance the customer doesn’t need |
| Inventory | Excess raw material, WIP, or finished goods | 3-month raw material stocks due to fear of supplier shortages; unsold finished goods |
| Motion | Unnecessary movement of people | Operators walking to collect tools, materials, or instructions that should be at the point of use |
| Defects | Products that don’t meet quality standards | Rework areas common in Indian factories — treating defect correction as a normal part of production |
| Unused Talent | Not using people’s knowledge and creativity | Shop floor workers who know how to fix a problem but are never asked — because ‘management decides’ |
4. VSM in Practice — Outcomes Indian Factories Achieve
| Factory Type | Before VSM | After Future State Implementation |
| Auto Component Manufacturer | Lead time: 18 days | VA ratio: 2.3% | Lead time: 4 days | VA ratio: 11% | Inventory reduced 65% |
| Pharma Packaging Plant | Lead time: 12 days | 6 production steps with queues | Lead time: 3.5 days | Continuous flow introduced for 3 steps | OEE +22% |
| Chemical Batch Plant | Lead time: 9 days | Large batch sizes | High WIP | Lead time: 3 days | Batch size halved | On-time delivery +40% |
| Engineering MSME | Lead time: 25 days | Customer complaints about delays | Lead time: 7 days | Delivery performance improved from 67% to 91% on-time |
FAQs — VSM India
Q1: How long does it take to complete a VSM exercise?
For a single product family in a factory with 5–10 process steps, a trained VSM team can complete the current state map in 2–3 days, design the future state in 1–2 days, and develop the implementation plan in 1 day. Total: approximately 5 days of focused effort. Larger or more complex value streams may require 7–10 days.
Q2: Can VSM be applied to service processes, not just manufacturing?
Yes — VSM originated in manufacturing but has been successfully applied to order processing, invoice management, R&D processes, maintenance workflows, and administrative functions. Any process with multiple sequential steps and waiting time between them can benefit from VSM analysis.
Q3: Do we need to bring in a consultant for VSM, or can we do it ourselves?
A trained internal team can conduct VSM independently. However, the first VSM exercise is significantly more valuable when facilitated by an experienced lean practitioner who can help the team see waste they have become accustomed to, accurately calculate value-added ratios, and design a realistic future state. Greendot Management Solutions typically trains your internal VSM champions during the first exercise, enabling them to lead subsequent VSMs independently.