
What Are the Six Big Losses in OEE?
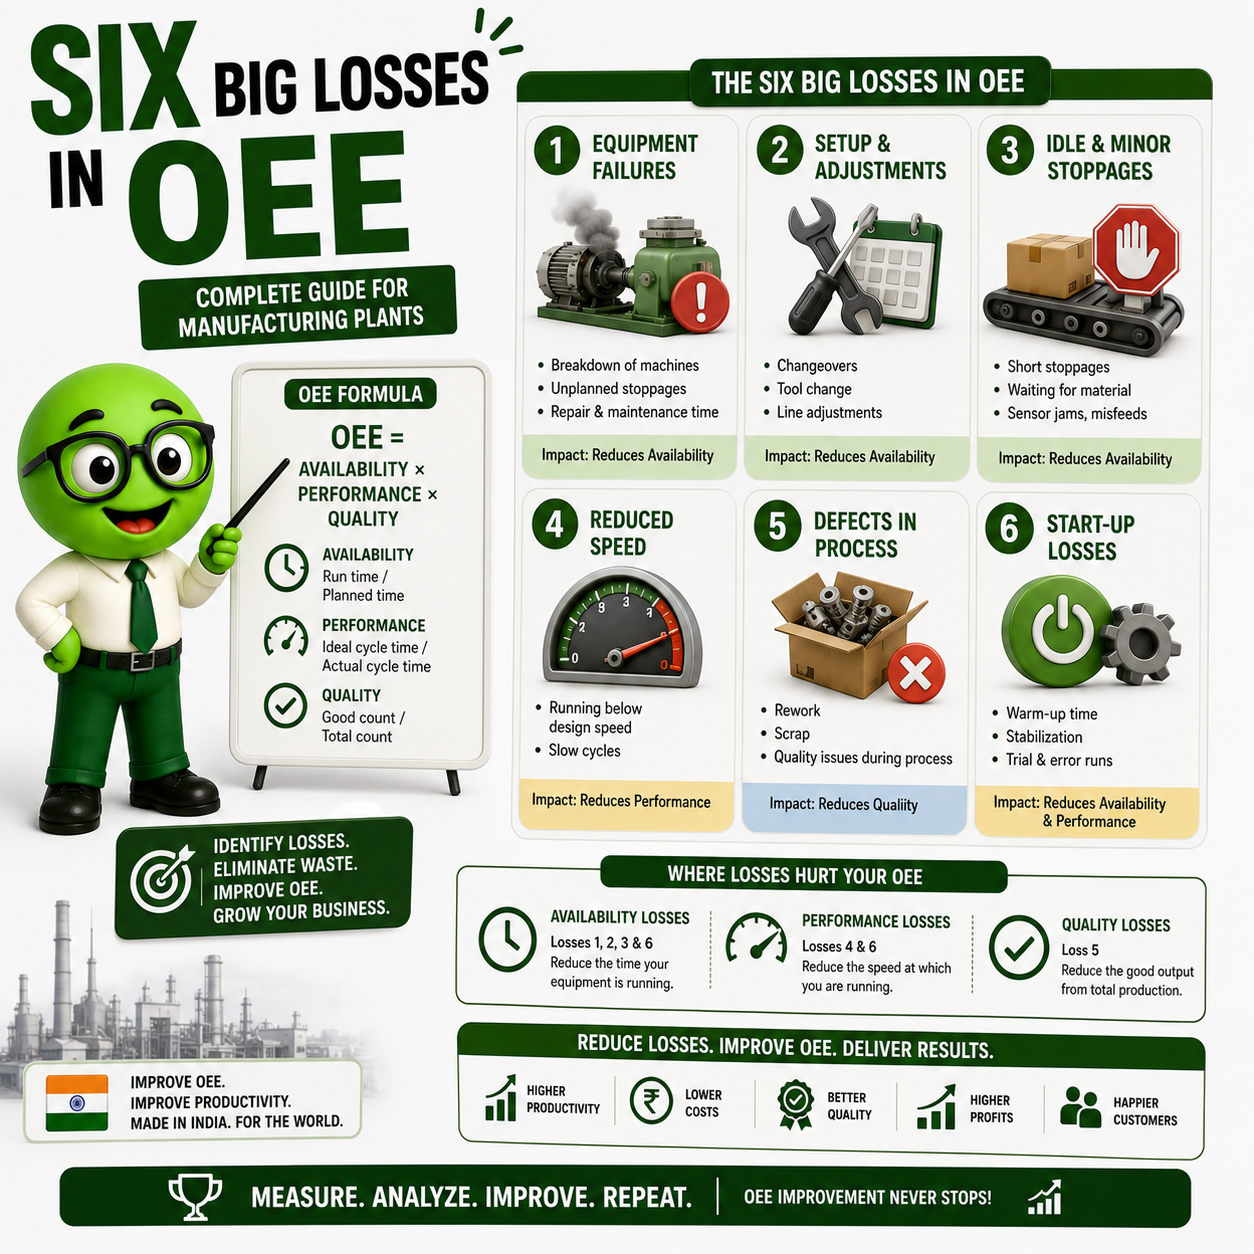
The Six Big Losses are the six most common causes of equipment-related productivity loss in manufacturing. They were defined by Seiichi Nakajima as part of the Total Productive Maintenance (TPM) methodology developed by the Japan Institute of Plant Maintenance (JIPM).
Together, these six losses explain why even a well-resourced factory rarely produces as much as it theoretically could.
The reason they matter for OEE is structural: Overall Equipment Effectiveness is calculated as:
OEE (%) = Availability (%) × Performance (%) × Quality (%)
Every one of the Six Big Losses reduces one of these three factors. Losses 1 and 2 reduce Availability. Losses 3 and 4 reduce Performance. Losses 5 and 6 reduce Quality. When you understand which loss belongs to which OEE category, you know exactly which part of your formula needs work — and which countermeasure to apply.
OEE Benchmarks to Know
| OEE Score | Classification |
|---|---|
| 85% and above | World-class (JIPM benchmark) |
| 65–85% | Good — room for systematic improvement |
| 45–65% | Typical for Indian SME manufacturing plants |
| Below 45% | Significant improvement opportunity |
In GreenDot’s experience across Gujarat, Maharashtra, and Rajasthan plants, most Indian manufacturers who have never formally measured OEE discover their actual score is 20–30 percentage points lower than they assumed. The Six Big Losses framework is how you find out exactly where that gap is coming from.
How the Six Big Losses Map to OEE
Understanding the relationship between each loss and OEE category is essential before you start measuring:
OEE = Availability × Performance × Quality
       ↑                ↑              ↑
  Loss 1 (Breakdowns)   Loss 3 (Small Stops)   Loss 5 (Start-up Rejects)
  Loss 2 (Setup/Adj.)   Loss 4 (Reduced Speed)  Loss 6 (Production Rejects)
This structure matters because you cannot fix an Availability problem with a Quality tool, and you cannot fix a Performance problem by reducing breakdowns. The right diagnosis leads to the right intervention.
Loss 1: Breakdowns (Equipment Failure)
OEE Impact: Availability ↓
What It Is
A breakdown is any unplanned stop in production caused by equipment failure — a machine that stops working and requires repair or intervention before production can resume. Most plants define a breakdown as an unplanned stop lasting more than 10 minutes; anything shorter is typically classified as a small stop (Loss 3).
Breakdowns are the most visible of the Six Big Losses. They are disruptive, create immediate pressure on the plant floor, and are usually the first loss that management notices. But in most plants, breakdowns that management sees are not the biggest contributor to lost OEE — it is the losses they cannot see (small stops, speed loss) that tend to be larger in aggregate.
How to Measure It
Breakdown Loss (%) = Total Unplanned Downtime ÷ Planned Production Time × 100
Example: In a shift of 480 minutes (planned production time), if a machine has 3 unplanned breakdowns totalling 75 minutes: Breakdown Loss = 75 ÷ 480 × 100 = 15.6% Availability from this loss alone = 100 − 15.6 = 84.4%
Track: machine name, breakdown start time, restart time, failure description, and repair action — in every shift, without exception.
Common Root Causes in Indian Plants
- Deferred maintenance (“we’ll fix it in the next scheduled shutdown”) that allows a minor fault to become a major failure
- Lack of daily inspection by operators — problems that are visible and audible weeks before failure go unreported
- Lubrication failures — incorrect lubricant, over- or under-lubrication, missed schedules
- Electrical faults caused by power fluctuation (common in industrial areas across Gujarat and Maharashtra)
- Wear and fatigue on components running beyond their designed service life
What to Do About It
The primary tool for reducing breakdown loss is the Planned Maintenance pillar of TPM, combined with Autonomous Maintenance (Jishu Hozen) to bring operators into daily equipment care. Specifically:
- Implement daily cleaning-inspection-lubrication (CIL) routines led by operators
- Build preventive maintenance schedules based on manufacturer recommendations and actual failure history
- Use MTBF (Mean Time Between Failures) data to predict and pre-empt failure patterns
- Apply 5-Why analysis to every breakdown to eliminate root causes, not just symptoms
Example from Indian Manufacturing
At a chemical plant in the Ankleshwar GIDC, three reactors were experiencing an average of 4.2 unplanned breakdowns per week each — primarily from seal failures caused by intermittent corrosive leaks that operators had learned to ignore. After establishing a daily operator inspection checklist (part of Autonomous Maintenance), leaks were identified and logged at the incipient stage. Within 90 days, breakdown frequency dropped to less than one per reactor per week. The seal replacement cost remained the same; the unplanned downtime cost virtually disappeared.
Loss 2: Setup and Adjustment (Changeover Loss)
OEE Impact: Availability ↓
What It Is
Setup and Adjustment loss is the time lost between the last good part of one production run and the first consistently good part of the next run. It includes physical changeover (die change, tool change, material change), machine warm-up, trial runs, and fine-tuning adjustments until the output meets specification.
This is a planned loss — you know it is coming — but it still reduces your available production time. In Indian plants running multiple products, models, or SKUs on the same machine, setup time is often the single largest contributor to Availability loss.
How to Measure It
Setup Loss (%) = Total Changeover Time ÷ Planned Production Time × 100
Changeover time starts when the last good part of the previous run is produced and ends when the first consistently good part of the new run meets specification. Many Indian plants measure changeover start-to-start (machine stop to machine start), which underestimates the loss because adjustment time after restart is not captured.
Example: A machine produces 3 products per shift and each changeover takes 45 minutes: Total setup loss = 3 × 45 = 135 minutes out of 480 planned minutes = 28% Availability loss from changeover alone.
Common Root Causes in Indian Plants
- All changeover activities treated as “internal” (done while machine is stopped), when many could be done while the previous run is still running
- Tools and materials not pre-staged — operators walk to stores during changeover
- No standard changeover procedure — every operator does it differently, in a different sequence
- No pre-setting: temperature, pressure, and dimension adjustments made after the machine stops, not before
- In pharma and chemical plants: excessive cleaning time during product changeover due to no standardised cleaning verification
What to Do About It
The primary tool is SMED (Single-Minute Exchange of Die) — a systematic methodology for reducing changeover time by separating activities that must happen with the machine stopped (internal) from activities that can happen while the machine runs (external). GreenDot’s SMED consulting practice has helped manufacturers across Gujarat reduce changeover times by 50–70% without major capital investment.
Example from Indian Manufacturing
A pharma packaging line in Ahmedabad was spending 4.5 hours changing over between product batches. The majority of this time was consumed by activities that could have been completed before the machine stopped — pre-staging cartons, labels, and inserts; completing documentation; and pre-setting fill volumes. After SMED implementation, true internal changeover time was reduced to 90 minutes — a 67% reduction — without any new equipment. The recovered time was converted directly into additional production capacity.
Loss 3: Small Stops (Idling and Minor Stoppages)
OEE Impact: Performance ↓
What It Is
Small stops are brief, repeated interruptions in production — typically lasting less than 10 minutes each — where the machine stops or runs empty but does not require maintenance or repair to restart. The operator typically resolves the stop themselves: clearing a jam, repositioning a part, restarting a cycle.
Individually, each small stop seems trivial. Collectively, they are often the largest single loss on a production line — and the hardest to quantify, because they are almost never formally recorded.
This is the most underestimated of all Six Big Losses in Indian manufacturing.
In plants where GreenDot has conducted OEE baseline studies, operators consistently underreport small stops by a factor of 3–5×. When asked, they say “maybe 2 or 3 jams per shift.” When a time-study observer is posted on the line, the actual count is 10–15+ per shift. The reason: operators have normalised these stops as part of how the machine works.
How to Measure It
Performance (%) = (Ideal Cycle Time × Total Parts Produced) ÷ Operating Time × 100
Small stops show up as the gap between this Performance figure and 100%. They cannot easily be measured individually — you measure their total impact through performance rate and investigate root causes through observation and operator interviews.
Common Root Causes in Indian Plants
- Material feed problems: incorrect material dimensions, burrs, contamination causing jams
- Worn guides, sensors, and stops that were calibrated for a new machine — not the current worn state
- Packaging lines: label misfeeds, cap jams, fill-level sensor drift
- Textiles: thread breaks and yarn tangles on looms and winding machines
- Accumulated debris in conveyor systems, chutes, and part feeders not cleaned during daily operations
What to Do About It
- Post an observer on the line for one full shift and record every stop, duration, location, and trigger — the pattern will identify the dominant cause within a single shift
- Apply 5-Why analysis to the top 2–3 stop types found
- Implement Jishu Hozen (Autonomous Maintenance) — operators who clean and inspect their own machines catch wear, debris, and misalignment before they cause stops
- Improve cleaning standards: many small stops in Indian plants are caused by accumulated material, dust, and debris that builds up because cleaning routines are inadequate
Example from Indian Manufacturing
A plastics injection moulding plant in Surat was recording Performance at 71% — but operators were only logging 2–3 small stops per shift. When GreenDot conducted a one-shift time study, 14 small stops were recorded, 9 of which were caused by short shots triggered by a temperature controller that had drifted from its calibrated setting. The controller was recalibrated (20-minute task). Performance recovered to 88% within two weeks.
Loss 4: Reduced Speed (Speed Loss)
OEE Impact: Performance ↓
What It Is
Speed loss occurs when a machine operates below its nameplate (designed) speed. The machine is running — there are no stops — but it is producing fewer units per minute than it was designed to. This is often invisible because the machine appears to be working normally. No alarms are triggered, no operator reports it, and shift production records simply show “normal output.”
The comparison that matters is not how fast the machine ran yesterday — it is how fast it was designed to run.
How to Measure It
Speed Loss (%) = 1 − (Ideal Cycle Time ÷ Actual Cycle Time)
Example: A machine’s ideal (nameplate) cycle time is 6 seconds per unit. Actual measured cycle time is 8 seconds. Speed Loss = 1 − (6 ÷ 8) = 1 − 0.75 = 25% Performance loss from speed reduction alone.
Many Indian plant managers do not know their machine’s nameplate/ideal cycle time. This is the first thing to establish when measuring speed loss.
Common Root Causes in Indian Plants
- Operators deliberately running machines slower than rated speed — sometimes as a habit after a previous quality problem, sometimes from training that was never updated
- Management that has accepted reduced speed as normal without knowing the designed speed
- Worn tooling: as dies, cutters, and moulds wear, speed is reduced to maintain quality — but the root cause (worn tooling) is not addressed
- Mechanical wear: bearing wear, belt slippage, drive system degradation causing the machine to run slower than its drive setting
- In Gujarat textile plants: loom RPM reduced to compensate for yarn quality variability rather than addressing the yarn quality problem directly
What to Do About It
- Establish the nameplate/ideal cycle time for every machine from the manufacturer’s manual — this is your target
- Conduct time studies across multiple shifts and operators to find actual cycle times
- Investigate why actual speed differs from ideal: operator habit, machine wear, quality concerns, or upstream/downstream constraints
- Implement autonomous maintenance to address mechanical wear before it causes speed reduction
Breakdowns vs. Small Stops: A Common Source of Confusion
| Factor | Breakdown (Loss 1) | Small Stop (Loss 3) |
|---|---|---|
| Duration | Typically > 10 minutes | Typically < 10 minutes |
| Requires maintenance? | Usually yes — technician needed | No — operator resolves it themselves |
| OEE category | Availability | Performance |
| Recorded in logs? | Usually yes | Usually no — this is the problem |
| Frequency | Lower | Higher — often 10–20× per shift |
| Root cause | Equipment failure / wear | Material, sensor, debris, alignment issues |
| Primary countermeasure | Planned Maintenance, TPM | Jishu Hozen, 5-Why, cleaning standards |
The threshold between Loss 1 and Loss 3 varies by plant — some use 5 minutes, some use 10. What matters is that you define it clearly and apply it consistently. The key insight: total small stop time in a shift is very often greater than total breakdown time, but because each individual stop is small, it is never formally recorded or investigated.
Loss 5: Start-up Rejects (Reduced Yield)
OEE Impact: Quality ↓
What It Is
Start-up rejects are defective products produced at the beginning of a production run — during machine warm-up, after a changeover, or after a planned maintenance shutdown — before the process has stabilised and reached its target operating parameters. These parts fail to meet specification and must be reworked or scrapped.
Every manufacturer expects some start-up rejects. The problem is when they are treated as inevitable rather than as a loss to be systematically reduced.
How to Measure It
Start-up Reject Rate (%) = Start-up Defective Units ÷ Total Units Produced × 100
Track start-up rejects separately from production rejects (Loss 6). Many plants lump all defects together, which prevents identifying whether defects are happening during warm-up, steady-state, or before shutdowns.
Common Root Causes in Indian Plants
- No documented standard for “when a process is stable and ready for production” — operators use judgment, which varies
- Temperature, pressure, and viscosity parameters that need time to reach equilibrium after a cold start or changeover — but the warm-up period is not formally defined or built into the production schedule
- In pharma and chemical plants: first batches after changeover that retain contamination from the previous product, failing in-process testing
- In injection moulding (common in Gujarat and Maharashtra): first shots after mould heating are dimensionally non-conforming due to thermal expansion — this is normal physics, but the number of rejects can be dramatically reduced with proper warm-up SOPs
What to Do About It
- Define a formal warm-up procedure for each machine/product combination: temperature set-point, number of trial shots before first inspection, and sign-off criteria
- Implement Poka Yoke mechanisms that prevent production output from being collected until process parameters are within spec — simple sensor interlocks can enforce this automatically
- Reduce the root cause of start-up rejects by reducing the length and frequency of changeovers (SMED reduces setup time and the associated quality instability)
Loss 6: Production Rejects (Process Defects)
OEE Impact: Quality ↓
What It Is
Production rejects are defective units produced during normal, steady-state production — not at start-up or changeover, but during the main production run when the process should be under control. This is the loss that most quality systems are designed to detect. But detecting defects after they are made is always more expensive than preventing them.
Production rejects represent both a material cost (wasted input material) and a time cost (machine time spent making parts that cannot be shipped).
How to Measure It
Quality Rate (%) = Good Units ÷ Total Units Produced × 100
Example: In a shift producing 2,400 units, 144 are rejected during the run. Quality Rate = (2,400 − 144) ÷ 2,400 = 2,256 ÷ 2,400 = 94% This one loss reduces your OEE Quality factor to 94% before any other quality losses are counted.
Common Root Causes in Indian Plants
- Process parameters (temperature, pressure, speed, humidity) that drift during the production run without detection
- Incoming material quality variation — raw materials from suppliers that vary batch-to-batch, causing defects at certain points in the run
- Operator-to-operator variation when no standard work instruction or visual guide is in place
- Tool wear: as a cutting tool, die, or mould wears during a long run, defect rate gradually increases — often unnoticed until end-of-shift inspection reveals the problem
- In Gujarat ceramics (Morbi): dimensional and surface defects in tiles caused by kiln temperature variation and body moisture inconsistency
What to Do About It
- Implement SPC (Statistical Process Control) to detect process drift before it produces defects
- Apply Poka Yoke (mistake-proofing) at high-defect points in the process — physical and sensor-based mechanisms that make defects impossible or immediately detectable
- Define and enforce process parameter windows — not just target values but upper and lower control limits that trigger action before a defect occurs
- Shift from end-of-line inspection to in-process inspection so defects are caught immediately when they occur, not at the end of the shift
Start-up Rejects vs. Production Rejects: Why the Distinction Matters
| Factor | Start-up Rejects (Loss 5) | Production Rejects (Loss 6) |
|---|---|---|
| When they occur | During warm-up / changeover recovery | During steady-state production |
| Root cause | Process not yet stabilised | Process instability or variation during run |
| Primary solution | Warm-up SOPs, Poka Yoke interlocks | SPC, in-process inspection, Poka Yoke |
| Reduced by | Fewer, faster changeovers (SMED) | Process control, material control, training |
| Typical % of total defects | 5–20% | 80–95% |
Tracking them separately gives you a much clearer picture. If your start-up reject rate is high, your changeover process needs improvement. If your production reject rate is high, your process control needs improvement. Combining them into a single “defect rate” number obscures both problems.
The Six Big Losses in Context: Indian Industry Examples
Different industries in India experience the Six Big Losses very differently. Here is a sector-by-sector pattern based on GreenDot’s consulting experience:
| Industry / Region | Dominant Loss | Typical Cause |
|---|---|---|
| Auto-components, Pune / Sanand | Loss 2 (Setup) | High product variety, frequent model changeovers |
| Chemical plants, Ankleshwar / Vapi | Loss 1 (Breakdowns) | Corrosive environments accelerating wear and seal failures |
| Textiles, Surat | Loss 3 (Small Stops) | Thread breaks, yarn quality variation, loom alignment |
| Pharma, Ahmedabad / Baddi | Loss 5 (Start-up Rejects) | Stringent GMP requirements, complex product changeovers |
| Ceramics / Tiles, Morbi | Loss 6 (Production Rejects) | Kiln temperature variation, body moisture inconsistency |
| FMCG packaging, across Gujarat | Loss 3 + Loss 4 | Label jams, fill-level sensor drift, reduced line speed |
| Plastics / Injection moulding | Loss 3 + Loss 5 | Short shots, mould warm-up dimensional non-conformance |
Understanding which loss dominates in your sector and your specific plant is the starting point — not a generic framework applied uniformly.
Six Big Losses vs. 16 Major Losses in TPM
The Six Big Losses are the foundation. TPM extends this framework into the 16 Major Losses — a more granular taxonomy that includes losses related to energy, labour, tools, and material yield in addition to the six equipment-focused losses.
| Six Big Losses (OEE) | Extended in TPM 16 Major Losses |
|---|---|
| Breakdowns (Loss 1) | Equipment failure loss (Loss 1 of 16) |
| Setup & Adjustment (Loss 2) | Setup and adjustment loss (Loss 2 of 16) |
| Small Stops (Loss 3) | Idling and minor stoppages (Loss 4 of 16) |
| Reduced Speed (Loss 4) | Speed loss (Loss 5 of 16) |
| Start-up Rejects (Loss 5) | Startup and yield losses (Loss 6 of 16) |
| Production Rejects (Loss 6) | Quality defects and rework (Loss 3 of 16) |
| — | + 10 additional losses: tooling, shutdown, management, motion, transport, organisation, energy, material yield, etc. |
If your plant has already addressed the Six Big Losses and still has OEE below 65%, the 16 Major Losses in TPM framework is your next diagnostic tool.
How to Start: Prioritising the Six Big Losses for Indian SMEs
With limited time and resources, the question is always: where do I start? Here is a practical priority sequence based on GreenDot’s experience implementing OEE improvement in Indian manufacturing plants:
Step 1: Measure before acting Before any improvement work, measure your current OEE for at least 2 weeks across all shifts. Use a simple paper-based loss log if you do not have software. You cannot prioritise without data.
Step 2: Find your biggest loss in rupee terms Convert each loss to rupee impact:
₹ Loss = (Loss Time in Hours) × (Machine Output Value per Hour)
For a machine generating ₹80,000/hour of output:
- 45 minutes of daily breakdown = ₹60,000/day = ₹1.5 crore/year
- 30% speed loss = 2.4 hours/shift equivalent = ₹1.92 lakh/shift
This calculation changes the conversation from “we always have these stops” to “this is costing us ₹X — can we justify spending ₹Y to fix it?”
Step 3: Apply the right tool to the right loss Do not apply 5S to a breakdown problem. Do not apply SPC to a small stop problem. The Six Big Losses framework exists precisely so that the right countermeasure targets the right loss.
Step 4: Start with Losses 3 and 4 if you are new to OEE In most Indian SME plants, small stops and speed loss together account for 40–60% of total OEE loss — but they require no capital investment to address. They require observation, root cause analysis, operator engagement, and cleaning standards. This makes them the highest-return starting point for most plants.
OEE Improvement: A Worked Example
A mid-sized auto-component plant in Sanand, Gujarat (100 employees, 3 shifts, 5 CNC machines) conducts its first OEE measurement:
| OEE Factor | Measured Value | Loss Source |
|---|---|---|
| Availability | 74% | 68 min/shift breakdown + 38 min setup |
| Performance | 79% | Small stops (unrecorded) + 7% speed gap |
| Quality | 93% | Production rejects on 2 of 5 machines |
| OEE | 74% × 79% × 93% = 54.4% |
World-class target: 85%. Current: 54.4%. The gap is 30.6 percentage points.
Prioritised improvement plan:
- Loss 3 (Small Stops): Time study conducted — 12 stops per shift on average, 9 caused by chip accumulation in coolant system. Improved cleaning schedule implemented. Performance recovers to 88%.
- Loss 2 (Setup): SMED applied to top 3 changeover types. Setup time reduced from 38 to 18 minutes average. Availability improves to 82%.
- Loss 1 (Breakdowns): CIL (Clean-Inspect-Lubricate) routines implemented by operators. Breakdown frequency falls by 60%. Availability reaches 89%.
Revised OEE after 6 months: 89% × 88% × 93% = 72.9% — a 34% improvement in output from the same machines, without adding capacity.
Frequently Asked Questions
What are the Six Big Losses in OEE? The Six Big Losses are the six most common causes of equipment productivity loss in manufacturing: Breakdowns, Setup and Adjustment, Small Stops, Reduced Speed, Start-up Rejects, and Production Rejects. They were defined by Seiichi Nakajima as part of the TPM methodology developed by JIPM (Japan Institute of Plant Maintenance).
Which OEE category does each loss belong to? Breakdowns and Setup/Adjustment reduce Availability. Small Stops and Reduced Speed reduce Performance. Start-up Rejects and Production Rejects reduce Quality. OEE is calculated as Availability × Performance × Quality.
What is the difference between breakdowns and small stops? Breakdowns are unplanned stops that typically last more than 10 minutes and require a technician or maintenance person to resolve. Small stops last less than 10 minutes and are typically resolved by the operator without maintenance intervention. Both reduce OEE, but through different categories: breakdowns reduce Availability, small stops reduce Performance.
What is the difference between start-up rejects and production rejects? Start-up rejects occur during machine warm-up or after a changeover, before the process has stabilised. Production rejects occur during steady-state production when the process should be under control. Both reduce the Quality factor of OEE, but they have different root causes and require different solutions.
What is a good OEE score for an Indian manufacturing plant? The world-class benchmark established by JIPM is 85%. Most Indian SME manufacturing plants, when formally measured for the first time, fall in the 45–65% range. An OEE above 75% is a reasonable medium-term target for Indian plants implementing TPM and OEE improvement for the first time.
Which of the Six Big Losses causes the most damage in Indian plants? This varies by industry. In high-variety plants (auto-components, pharma), Setup Loss (Loss 2) is often the largest Availability loss. In process industries (chemicals, FMCG), Small Stops (Loss 3) and Speed Loss (Loss 4) typically dominate. In most Indian plants that have never formally measured, small stops are severely underestimated because they are not recorded.
How do you track the Six Big Losses on the shop floor? Start with a simple paper-based loss log at each machine: record every unplanned stop (time, duration, cause), every changeover (start time, end time), and every defect (quantity, type). Dedicate 5 minutes at each shift end to complete the log. Once you have 2–4 weeks of data, patterns become clear and you can prioritise which loss to address first.
How are the Six Big Losses related to TPM? The Six Big Losses are the primary measurement framework within TPM (Total Productive Maintenance). TPM’s pillar structure — Planned Maintenance, Autonomous Maintenance (Jishu Hozen), Focused Improvement, and Quality Maintenance — is essentially a system of countermeasures to the Six Big Losses. You cannot implement TPM effectively without first understanding which losses are largest in your plant.
Can the Six Big Losses framework apply to small factories? Yes — in fact, the framework is more impactful in smaller plants because each percentage point of OEE improvement has direct bottom-line visibility. A small factory running one machine at 55% OEE and improving to 75% OEE has effectively added one-third more production capacity without buying any new equipment. The measurement tools do not need to be digital — a simple paper-based loss log is sufficient to start.
How does SMED help with the Six Big Losses? SMED (Single-Minute Exchange of Die) directly addresses Loss 2 (Setup and Adjustment) by separating changeover activities into those that must happen with the machine stopped (internal) and those that can be done while the machine runs (external). By moving as many activities as possible to external, and optimising internal activities, changeover time is typically reduced by 50–70%. This has a compounding effect: faster changeovers also mean fewer start-up rejects (Loss 5) because the process reaches stability faster.
How GreenDot Can Help
GreenDot Management Solutions has implemented OEE measurement and Six Big Loss reduction programs in manufacturing plants across Gujarat, Maharashtra, and Rajasthan — including at Atul Limited, Castrol, Pidilite, and UPL.
Our approach:
- OEE Baseline Measurement — We measure your actual OEE across all machines and shifts for 2–4 weeks
- Loss Analysis — We identify your dominant losses in rupee terms, not just percentages
- Prioritised Improvement Plan — We sequence improvement actions by ROI, starting with zero-investment changes
- Implementation Support — TPM Consulting, SMED for Setup Loss, Kaizen for continuous improvement
- Team Training — We train your operators and supervisors to sustain OEE improvement independently
Related Resources
- OEE: Formula, Calculation, and Benchmarks — How to calculate your OEE step by step
- 16 Major Losses in TPM — The extended loss framework beyond the Six Big Losses
- TPM Implementation Guide — How to build a TPM program in your plant
- SMED: Reducing Setup and Changeover Time — The countermeasure for Loss 2
- Poka Yoke: Mistake-Proofing for Quality Losses — The countermeasure for Losses 5 and 6
- Kaizen Implementation — Continuous improvement approach to OEE