
What Are the 8 Wastes of Lean Manufacturing?
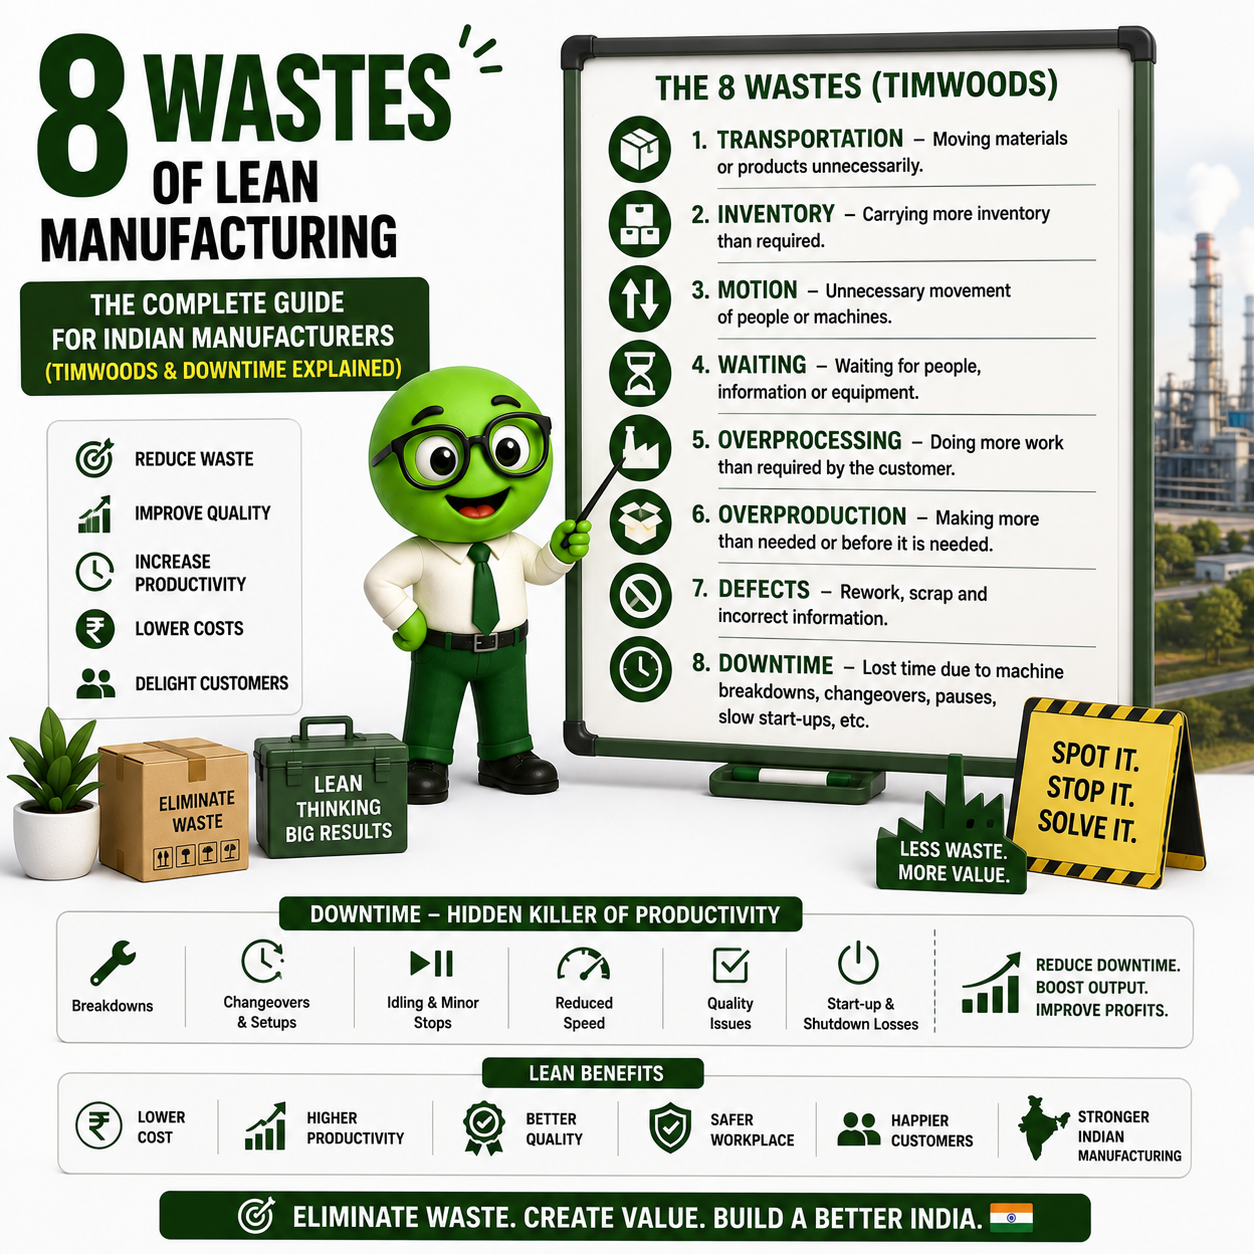
The 8 Wastes of Lean Manufacturing are eight categories of activity that consume time, money, and resources without adding any value for the customer. They are the primary targets of any Lean Manufacturing improvement effort.
In simple terms: waste is anything your customer would refuse to pay for if they could see it happening on your shop floor.
The framework originated in the Toyota Production System (TPS), developed by Taiichi Ohno starting in the 1950s. Ohno originally identified 7 wastes — known in Japanese as Muda (無駄), meaning wastefulness or uselessness. As Lean spread beyond Japan into Western and global manufacturing, an 8th waste was added: the waste of non-utilized human talent.
Today, both the original 7 and the full 8 are widely used. Understanding both acronyms helps you remember and apply the framework.
TIMWOODS vs DOWNTIME: Two Ways to Remember the 8 Wastes
Both acronyms cover the same 8 wastes — they are simply two different memory aids used in Lean training.
| Letter | TIMWOODS | Letter | DOWNTIME |
|---|---|---|---|
| T | Transportation | D | Defects |
| I | Inventory | O | Overproduction |
| M | Motion | W | Waiting |
| W | Waiting | N | Non-utilized Talent |
| O | Overproduction | T | Transportation |
| O | Over-processing | I | Inventory |
| D | Defects | M | Motion |
| S | Skill/Talent | E | Extra-processing |
Neither acronym is “correct” — use whichever your team remembers more easily. In training sessions across Gujarat and Maharashtra, we find that DOWNTIME resonates more quickly with shop-floor teams because it evokes what waste causes: downtime.
What Is Muda — and What Are Mura and Muri?
Muda (waste) is only one of three types of operational loss that Lean addresses. Understanding all three gives a more complete picture of inefficiency:
| Japanese Term | Meaning | Example |
|---|---|---|
| Muda (無駄) | Waste — activity that adds no value | Reworking a defective batch |
| Mura (斑) | Unevenness — irregular or inconsistent flow | Production bursting in the last week of the month to meet targets |
| Muri (無理) | Overburden — pushing people or machines beyond their capacity | Running a machine at 110% to clear a backlog, leading to breakdown |
Most shop floors focus only on Muda. But if you address Muda without fixing Mura (scheduling variability) and Muri (overloading), the wastes come back. Eliminating all three together is the foundation of a sustainable Lean consulting engagement.
7 Wastes vs 8 Wastes: What Is the Difference?
| 7 Wastes (Original TPS) | 8 Wastes (Modern Lean) | |
|---|---|---|
| Origin | Taiichi Ohno, Toyota, 1950s–70s | Western Lean practitioners, 1990s onward |
| Wastes covered | Transportation, Inventory, Motion, Waiting, Overproduction, Over-processing, Defects | All of the above + Non-utilized Talent/Skill |
| Where used | Traditional manufacturing, TPS training | Modern Lean, Lean Six Sigma, service industries |
| Which to use | Either — both are valid | 8 wastes for any team-based improvement program |
The 8th waste — non-utilized talent — was added because Ohno’s original framework focused on physical production flow. As Lean spread into knowledge work and service industries, it became clear that ignoring employees’ ideas and capabilities was itself a major source of lost value. In Indian manufacturing specifically, where shop-floor operators often hold deep process knowledge that is never formally captured, this 8th waste is frequently the most significant.
The 8 Wastes Explained: Definitions, Root Causes, Indian Examples, and Lean Tools
1. Transportation Waste (T)
What it is: Any movement of materials, components, or products that does not directly add value. Transportation does not transform a product — it only moves it. Every unnecessary move adds cost, handling risk, and lead time.
Common root causes:
- Poor factory layout — machines and workstations placed far apart without considering material flow
- Centralised stores or inspection areas requiring parts to travel across the floor
- Batch-and-queue production rather than one-piece or continuous flow
Indian manufacturing example: In many chemical plants in South Gujarat, raw material arrives at a central receiving area, moves to a warehouse, then to an intermediate store, then to the production floor — three separate moves before any value is added. A lean layout review typically eliminates at least one of those moves.
Impact on OEE: Transportation is a primary contributor to availability loss and extended production lead time.
Lean tools to eliminate it:
- Value Stream Mapping (VSM) — visualises all movement in the production process
- 5S-based layout redesign — places materials close to point of use
- Inventory Reduction Consulting — reduces the volume of material that needs to be moved
2. Inventory Waste (I)
What it is: Any raw material, work-in-progress (WIP), or finished goods held in excess of what is currently needed. Inventory is not just a physical problem — it is a cash flow problem. Every rupee tied up in unsold stock is a rupee not available for investment.
Common root causes:
- Overproduction (inventory waste and overproduction waste directly create each other)
- Large batch sizes driven by long machine changeover times
- Poor demand forecasting, or planning to the “safe side”
- Supplier minimum order quantities (MOQs) that exceed production needs
Indian manufacturing example: A Rajasthan-based packaging manufacturer was carrying 45 days of raw material inventory because the procurement team was buying in large lots to negotiate better prices. The actual savings on material cost were being negated by storage costs, obsolescence, and tied-up working capital. A Kanban-based reorder system reduced inventory to 18 days without affecting service levels.
Impact on OEE: Excess inventory hides machine breakdowns, quality problems, and scheduling failures — it is a symptom masking other wastes.
Lean tools to eliminate it:
- Inventory Reduction Consulting — system-level approach to optimising stock levels
- Kanban systems — visual pull-based replenishment
- SMED Consulting — reducing changeover time enables smaller, more frequent batches
3. Motion Waste (M)
What it is: Any unnecessary movement of people that does not add value. Motion waste is often confused with transportation waste — the distinction is simple: transportation is the movement of materials; motion is the movement of people (or machine components).
Common root causes:
- Poorly designed workstations — tools, materials, or controls placed out of ergonomic reach
- No 5S system — workers searching for tools, gauges, or documents
- Shared tools or equipment that require walking to retrieve
Indian manufacturing example: In a precision engineering plant in Pune, a time-and-motion study revealed that machine operators were walking an average of 2.4 km per shift — not to add value, but to retrieve tools from a shared cabinet 18 metres away. Redesigning the workstation with shadow boards and point-of-use storage eliminated this motion and recovered approximately 22 minutes of productive time per operator per shift.
Impact on OEE: Motion waste directly reduces performance rate — the machine is idle while the operator walks.
Lean tools to eliminate it:
- 5S Consulting — organises the workplace so everything needed is at hand
- Workstation ergonomics review
- Spaghetti diagram analysis — maps actual movement patterns on the shop floor
4. Waiting Waste (W)
What it is: Any time a person, machine, or process is idle because the next step is not ready. Waiting is the most visible waste on any shop floor — and often the most accepted, because people mistake it for unavoidable downtime.
Common root causes:
- Machine breakdowns (unplanned downtime)
- Waiting for material from an upstream process or supplier
- Waiting for approval, quality inspection, or information
- Unbalanced production lines where some workstations are faster than others
Indian manufacturing example: In a Gujarat textile processing unit, fabric was completing the dyeing stage and then waiting an average of 4.5 hours before entering the finishing stage — not because the finishing machines were occupied, but because the quality inspection between the two stages had only one inspector for three production lines. Adding a second inspector and implementing in-process visual checks eliminated most of this waiting time.
Impact on OEE: Waiting is the most direct contributor to availability loss in OEE.
Lean tools to eliminate it:
- TPM Consulting — preventive maintenance to reduce unplanned breakdowns
- Line balancing — equalising workload across all stations
- Kaizen implementation — structured problem-solving for recurring waiting causes
5. Overproduction Waste (O)
What it is: Making more than the customer needs, sooner than the customer needs it. Taiichi Ohno considered overproduction the “mother of all wastes” — because it creates or conceals every other waste. When you overproduce, you generate excess inventory, trigger additional transportation, consume materials that could have been saved, and hide quality problems.
Common root causes:
- “Just in case” production mentality — building a safety buffer without customer justification
- Large batch sizes driven by machine setup times
- Pressure to keep machines and people “busy” even when demand is not present
- Inaccurate demand forecasting
Indian manufacturing example: A FMCG company in Maharashtra was running full shifts through the last week of each month to hit production targets — regardless of actual orders. This produced 3–4 weeks of finished goods that had to be stored, managed, and eventually discounted if not sold within the expiry window. Introducing a pull-based production schedule aligned to actual customer orders reduced finished goods inventory by 35% within three months.
The antidote: Just in Time (JIT) production — make what is needed, when it is needed, in the quantity needed. This is one of the two pillars of the Toyota Production System.
Lean tools to eliminate it:
- Takt time calculation — set production rate to match customer demand
- Pull systems / Kanban
- Reduce Production Lead Time
6. Over-processing Waste (O / E)
What it is: Doing more work on a product or process than the customer requires or values. Over-processing is often invisible because it looks like quality effort — but if the customer is not asking for it and not paying for it, it is waste.
Common root causes:
- Processes designed for specifications tighter than customer requirements
- Using high-precision machinery for tasks that do not require that precision
- Multiple approval signatures or sign-offs where one would suffice
- Processes inherited from older product specifications that were never updated
- Redundant quality checks at every stage rather than at critical control points
Indian manufacturing example: A pharmaceutical packaging plant in Ahmedabad was applying three separate label inspection steps — automated, manual by operator, and final by quality supervisor — for a secondary packaging process where the regulatory requirement specified only one inspection point. The redundant checks added 40 minutes per batch with no improvement in customer-perceived quality.
Note on recycling: Recycling and rework are often cited as over-processing examples. To be precise: recycling is only waste when it results from overproduction or defects. Where it is an intended part of the process (e.g., solvent recovery in chemical manufacturing), it may be a necessary non-value-adding activity rather than pure waste.
Lean tools to eliminate it:
- Voice of Customer (VOC) analysis — verify what quality level the customer actually requires
- Process review against current specification — eliminate steps that specifications no longer require
- Standard Operating Procedures (SOPs) — ensure every step has a documented customer-facing reason
7. Defects Waste (D)
What it is: Any output — product, component, document, or service — that does not conform to specification and requires rework, repair, or scrapping. Defects are the most directly costly waste: they consume materials, time, machine capacity, and labour twice — once to make the defective item, and again to fix or replace it.
Common root causes:
- Inadequate process controls or missing SOPs
- Insufficient operator training on critical quality parameters
- Machine wear or calibration drift that is not caught preventively
- Accepting defective incoming materials from suppliers
Indian manufacturing example: A plastics injection moulding plant in Vapi was running a defect rate of approximately 4.8% on a high-volume automotive component. A root cause analysis through Kaizen revealed that mould temperature variation during the first 30 minutes of each shift was causing sink marks. Implementing a standard warm-up protocol and adding a process parameter control chart reduced the defect rate to below 1.2% within six weeks.
Prevention vs detection: The Lean principle is clear — invest in defect prevention, not just defect detection. Every defect found at the end of the process is more expensive than one caught at the source.
Lean tools to eliminate it:
- Poka-Yoke (mistake-proofing) — design processes so defects cannot occur or cannot pass undetected
- Jidoka (autonomation) — machines that detect abnormalities and stop automatically
- Statistical Process Control (SPC) — monitor process parameters to catch drift before defects occur
- Quality Circle — employee-led problem solving at the point of defect origin
8. Skill / Non-Utilized Talent Waste (S / N)
What it is: The waste of human potential — unused knowledge, skills, ideas, creativity, and capability that exist in your workforce but are never asked for or acted upon. This is the waste that Taiichi Ohno’s original 7 did not capture, and it may be the most expensive waste in Indian manufacturing today.
Common root causes:
- Hierarchical cultures where operators are not consulted on process improvement
- No formal suggestion system or Kaizen participation structure
- Cross-trained skills that are not deployed (e.g., a tool-setter who could train others, but never does)
- Placing qualified people in roles that do not use their core competency
Indian manufacturing example: In a chemical plant in South Gujarat, the maintenance team had two engineers with formal training in condition monitoring and vibration analysis. This capability had never been used because the plant had no predictive maintenance programme. When a TPM implementation was begun, this internal expertise was activated — and the plant avoided hiring an external specialist, saving significantly on consulting fees while improving equipment reliability.
Why this waste matters most in Indian SMEs: In our experience working with manufacturers across Gujarat, Maharashtra, and Rajasthan, operators often know exactly why a recurring defect happens or where the production bottleneck is — but are never asked. Closing this gap with structured Kaizen and Quality Circle programmes frequently delivers results faster than any equipment investment.
Lean tools to eliminate it:
- Kaizen implementation — structured continuous improvement involving all levels
- Quality Circle — small group problem-solving led by shop-floor employees
- Cross-training and skill matrix development
- Formal suggestion systems with rapid management response
Waste Identification: How to Do a Gemba Walk
A Gemba Walk (from Japanese gemba, 現場, meaning “the actual place”) is the most effective method for identifying wastes in a real manufacturing environment. Rather than reviewing reports or spreadsheets, a Gemba Walk takes you to the shop floor to observe what is actually happening.
4-Step Gemba Walk Process for Waste Identification
Step 1 — Define your focus. Choose one process, one workstation, or one production line per walk. Trying to observe everything at once means you see nothing properly.
Step 2 — Observe without intervening. Watch the process run for at least two full cycles. Note what you see without immediately trying to fix it. Look for: idle time, searching behaviour, piles of inventory, long distances between steps, any rework happening.
Step 3 — Use the 8 wastes checklist. For each waste, ask the observation question below:
| Waste | Observation Question |
|---|---|
| Transportation | Is material travelling more than 5 metres between steps? |
| Inventory | Is there visible accumulation of WIP between any two stations? |
| Motion | Are operators walking more than 2 steps to retrieve tools or materials? |
| Waiting | Is anyone or any machine idle for more than 30 seconds at any point? |
| Overproduction | Is output accumulating faster than the downstream step can process it? |
| Over-processing | Is any step being done more than once, or to a standard the customer does not require? |
| Defects | Is any rework, repair, or sorting happening anywhere in the process? |
| Skill/Talent | Are operators following instructions only, with no involvement in improvement? |
Step 4 — Prioritise and act. Not every waste found requires immediate action. Prioritise by: frequency of occurrence × impact on quality or lead time × ease of elimination. The highest-priority wastes become the input to your next Kaizen event.
How the 8 Wastes Connect to OEE
If your plant measures Overall Equipment Effectiveness (OEE), you can map every waste directly to an OEE loss:
| OEE Component | OEE Loss | Linked Wastes |
|---|---|---|
| Availability | Unplanned downtime, setup/changeover time | Waiting, Transportation, Defects (causing line stoppages) |
| Performance | Reduced speed, minor stoppages | Motion, Over-processing, Waiting |
| Quality | Defective output, rework | Defects, Over-processing |
Improving OEE without first addressing the 8 wastes is difficult — the wastes cause the OEE losses. This is why TPM Consulting and waste elimination programmes are designed to work together.
Waste Elimination: The 6-Step Approach
Once wastes are identified, elimination follows a structured hierarchy:
| Priority | Approach | Description |
|---|---|---|
| 1 | Eliminate | Remove the step or activity entirely — the best outcome |
| 2 | Prevent | Redesign the process so the waste cannot occur (Poka-Yoke) |
| 3 | Reduce | Reduce frequency or impact where full elimination is not yet possible |
| 4 | Replace | Substitute a wasteful step with a better method |
| 5 | Detect early | Identify waste at the earliest point to minimise downstream damage |
| 6 | Mitigate | Manage the consequences where waste cannot yet be eliminated |
Always start with elimination. Every step down this hierarchy means you are managing waste rather than removing it.
The Benefits of Eliminating the 8 Wastes
Structured waste elimination in Indian manufacturing plants consistently delivers:
- Production lead time reduced by 20–50% (verified across GreenDot client engagements in Gujarat and Maharashtra)
- Inventory reduction of 20–40%, freeing working capital without disrupting production
- Defect rates reduced by 50–80% through Poka-Yoke and SPC
- Machine uptime (OEE) improvement of 10–25% through waiting and downtime reduction
- Safer working environment — motion and transportation waste reduction also reduces handling injuries
- Higher employee engagement — operators involved in waste elimination feel ownership of the process
8 Wastes in Indian Manufacturing: Sector-Specific Patterns
From 25+ years of Lean consulting across Gujarat, Maharashtra, and Rajasthan, we observe consistent waste patterns by industry:
| Industry | Most Common Wastes | Typical Root Cause |
|---|---|---|
| Specialty Chemicals (Gujarat) | Inventory, Over-processing | Batch size driven by export MOQ; redundant quality steps |
| Automotive Components (Pune/Gujarat) | Defects, Motion | Tool/die wear; shared tools across workstations |
| Textiles (Surat) | Waiting, Transportation | Inspection bottlenecks between dyeing and finishing |
| Pharma/FMCG (Maharashtra) | Overproduction, Skill waste | Month-end push production; operators not in improvement loop |
| Agri-Chemicals (Rajasthan/Gujarat) | Transportation, Inventory | Long supplier lead times; over-purchasing to hedge |
| Packaging (Pan-India) | Defects, Over-processing | Outdated specifications; excessive approval chains |
Value-Added vs Non-Value-Added Activities
Not everything that appears wasteful is truly avoidable. Lean distinguishes between three categories:
| Category | Definition | Example |
|---|---|---|
| Value-Added (VA) | Transforms the product in a way the customer pays for | Welding, mixing, forming, assembly |
| Non-Value-Added but Necessary (NNVA) | Does not add value but is required by law, safety, or current process constraints | Quality inspection for regulatory compliance; machine warm-up |
| Pure Non-Value-Added (NVA) | Adds no value and is not required — pure waste | Moving parts across the floor unnecessarily; rework; waiting |
The goal of Lean is to eliminate NVA activities, minimise NNVA activities, and maximise the proportion of time spent on VA activities.
7 Wastes of Lean Manufacturing vs 8 Wastes — What’s the Difference?
Many lean practitioners refer to the 7 wastes of lean manufacturing, originally identified by Toyota’s Taiichi Ohno as part of the Toyota Production System (TPS). These 7 wastes are:
1. Transport
2. Inventory
3. Motion
4. Waiting
5. Overproduction
6. Over-processing
7. Defects
The 8th waste — Non-Utilized Talent (also called Skills waste) — was added later as lean manufacturing evolved beyond the shop floor into office and service environments. In modern lean practice, all 8 wastes are recognized.
Whether you call them 7 wastes or 8 wastes, the goal is the same — identify and eliminate activities that consume resources without adding value for the customer.
GreenDot helps Indian manufacturing SMBs identify and eliminate all 8 wastes through structured Lean implementation programs.
Frequently Asked Questions
What are the 8 wastes of lean manufacturing? The 8 wastes are Transportation, Inventory, Motion, Waiting, Overproduction, Over-processing, Defects, and non-utilized Skill/Talent. They are remembered using the acronyms TIMWOODS or DOWNTIME.
Who identified the 8 wastes of lean? Taiichi Ohno, chief engineer at Toyota, originally identified 7 wastes as part of the Toyota Production System in the 1950s–70s. The 8th waste (non-utilized talent) was added by Western Lean practitioners in the 1990s as Lean spread beyond manufacturing.
What is the difference between the 7 wastes and the 8 wastes? The 7 wastes are Ohno’s original framework covering physical production waste. The 8 wastes add non-utilized human talent, recognising that unused employee knowledge and capability is also a significant source of organisational waste.
Which waste is considered the most damaging? Overproduction is considered the “mother of all wastes” by Lean practitioners, because it generates or conceals all other wastes — it creates unnecessary inventory, requires additional transportation, hides defects, and consumes capacity that could be used for genuine customer demand.
What is the difference between motion waste and transportation waste? Transportation waste is the unnecessary movement of materials or products. Motion waste is the unnecessary movement of people (or machine components). A worker walking to retrieve a tool is motion waste. A forklift moving raw material from a distant warehouse is transportation waste.
How do the 8 wastes relate to OEE? The 8 wastes directly drive OEE losses. Waiting causes availability loss. Motion and over-processing reduce performance rate. Defects reduce quality rate. Eliminating the 8 wastes is therefore one of the most direct routes to improving OEE.
How do I identify the 8 wastes in my factory? The most effective method is a structured Gemba Walk — going to the shop floor, observing actual process flow, and checking for each waste category systematically. See the Gemba Walk checklist in this article.
Can the 8 wastes framework be applied in service industries? Yes. All 8 wastes appear in service industries including banking, healthcare, logistics, and IT services. Waiting (patient queues), defects (incorrect invoices), over-processing (redundant approval steps), and non-utilized talent are particularly prevalent in service environments.
How long does waste elimination take in an Indian manufacturing plant? Quick wins through 5S and Kaizen events are visible within 4–8 weeks. Systemic changes — including inventory optimisation, OEE improvement, and sustainable defect reduction — typically require a 6–18 month structured programme. The pace depends on management commitment and the extent of existing Lean infrastructure.
Where should I start if my factory has all 8 wastes? Start with a Gemba Walk to quantify which wastes are occurring most frequently and causing the most impact on lead time, quality, and cost. Typically, addressing Waiting, Defects, and Overproduction first delivers the fastest measurable results. 5S implementation is the most common starting point because it creates the visible order necessary to see and eliminate all other wastes.
What Comes After Waste Identification?
Identifying waste is the beginning of the Lean journey, not the end. A complete improvement roadmap looks like this:
- Gemba Walk → identify wastes by category and location
- Value Stream Mapping (VSM) → map the entire production flow and quantify waste at each step
- 5S Implementation → establish workplace organisation as the foundation
- Kaizen Events → targeted, rapid improvement of specific waste-generating processes
- SMED → reduce changeover times to enable smaller batches and reduce overproduction/inventory
- TPM → reduce machine-related waiting and defect waste through preventive and autonomous maintenance
- Standard Work → document and sustain improvements so gains are not lost
Each of these steps is a service GreenDot delivers across manufacturing plants in Gujarat, Maharashtra, and Rajasthan. Whether you are beginning your Lean journey or looking to take it to the next level, we work directly on your shop floor — not just in the training room.
Also Read
- What is Lean Manufacturing? A Complete Guide
- 5S Methodology: Complete Implementation Guide for Indian Manufacturers
- Kaizen: Continuous Improvement Consulting
- Total Productive Maintenance (TPM): Implementation Guide
- SMED: Reduce Setup and Changeover Times
- Inventory Reduction Consulting
- Quality Circle Consulting
- Reduce Production Lead Time